[N1] Signatures of subteam members.
The Photo and TV Support Team was established to analyze and document STS 51-L photography and video products. Results were made available to the Failure Analysis Team for use in evaluating failure scenarios. The Photo Team consisted of subteams at Johnson Space Center (JSC), Marshall Space Flight Center (MSFC) and Kennedy Space Center (KSC) that represented the imagery working elements of those Centers and included an independent team leader and a deputy.
The results of the Photo and TV Support Team activities are documented in this comprehensive report, the core of which is the STS 51-L Incident Integrated Events Timeline developed by the team to correlate imagery and telemetry events. This report describes the significant observed anomalies and related events of the STS 51-L accident and includes image enhancement results which were used to identify, locate, and determine time-related characteristics of the events. Conclusions and findings for follow-up efforts are included. A video tape showing significant events was prepared as in interim report. An updated tape is planned which will reflect the final results and will include voice annotation and pictures of selected recovered hardware.
The KSC photographic and TV system consists of 108 film and 69 TV cameras. For this investigation, approximately 13 million frames of imagery were evaluated, including films from previous flights. Additionally, films from private citizens and news media were made available to the team; this help was very much appreciated and letters of appreciation were sent to the contributors.
Although only a few of the events which were analyzed proved to be significant to the investigation, the analysis of the events was vital in establishing the cause of the STS 51-L incident. The primary anomalous events seen in the imagery are the early smoke and later flame issuing from the aft field joint of the right Solid Rocket Booster (SRB). All other anomalous events are the result of the failure indicated by these primary events.
Analysis of the smoke at lift-off was a combination of establishing the probable location, duration and dynamic characteristics of the smoke source. The source was determined to be at or near the aft field joint of the right SRB and circumferentially at approximately 300. This location was inferred geometrically from multiple camera locations since the source was not in the field of view of any camera. Image analysis also established that smoke first appeared at 0.678-second mission elapsed time (MET) and was last visible at 3.375 seconds MET. Frequency of the individual puffs was established (3 to 5 Hz) for comparison with overall vehicle dynamics.
There is no further evidence of the leak until 58.762 seconds MET, when an initially flickering, then steady flame was observed emanating from the right SRB. Photo analysis established its location to be the aft field joint in approximately the same location as the earlier smoke. Flicker frequency was determined to be approximately 10 Hz. (Note: Recovered right SRB hardware shows a burn through at this joint extending from 294° to 316°.)
Dimensions of the leak plume were estimated from the films and were used to support wind tunnel tests to characterize vehicle aerodynamics. Results of these tests were useful for trajectory reconstruction and also helped to explain the observed plume recirculation patterns.
Film analysis also determined the location of the impingement of the SRB leak plume on the External Tank (ET) and the effect of the plume of the resulting liquid hydrogen (LH2) leak. Film analysis showed the aft end of the right SRB separating from the ET. Geometric analysis of this motion indicates contact of the forward end of the right SRB and the ET intertank area. Finally, details of vehicle breakup and post-breakup characterization of the right SRB were determined. Since telemetry ceased at approximately 73 seconds, imagery and recovered hardware constituted the only evidence of the final destruction of the vehicle.
The activities of the team included analysis of closeout photography of the aft field joint where an initial review had indicated a possible O-ring flaw. Enhancement and mensuration of the film explained the observations and eliminated the concern of an O-ring flaw prior to mating.
In addition to these conclusions and findings, several important lessons were learned during this investigation. The imagery collected as a result of the clear-day weather was very significant in the accident analysis efforts. Had it been a night launch or a launch with an overcast sky, the amount of time required to reach the conclusions drawn would have been much greater and perhaps never as clearly: understood. Therefore, launch visibility for photographic reasons should be a primary mission rule until the hardware fixes resulting from this investigation are proved operational.
There is a need for better intercenter and intracenter organization of the photo and TV analysis to support both normal launches and contingency operations. Additionally, camera failures on launch day prevented a clear view of the hardware failure point. More and better cameras are required. Additionally, a review of the types of film used to better aid photo enhancement activities is required. A total review of the requirements for imagery and analysis methodology with a goal of improving imagery acquisition, processing, analysis, and archiving is required.
There is a requirement for the Space Transportation System (STS) program to charter an intercenter photographic/TV working group to document the activities required to implement the findings and conclusions of this report.
[N4] II. APPOINTMENT/TEAM CHARTER.
|
The following letter and its attachment establish the Photography and Television Support Team and appoint the Team Lead. |
|
|
|
March 20, 1986 |
51-L DATA AND DESIGN ANALYSIS TASK FORCE
|
TO: |
D. Germany |
|
FROM: |
Task Force Chairman |
|
SUBJECT: |
Appointment of Lead, Photo and TV Support Team |
|
|
|
| |
|
| |
|
Richard H. Truly | |
Attachments 2
|
TO: |
M/Chairman, STS 51-L Data and Design Analysis Task Force |
|
FROM: |
A/AD/Acting Administrator |
|
SUBJECT: |
Establishment of the STS 51-L Data and Design Analysis Task Force |
|
REF: |
Memorandum to M/Associate Administrator for Space Flight from AD/A/Acting Administrator, Subject: Formation of the STS 51-L Data and Design Analysis Task Force, dated February 5, 1986 |
1. Pursuant to the above reference, the STS 51-L Data and Design Analysis Task Force was created to replace the interim Mishap Investigation Board and to support the activities of the Presidential Commission on the Space Shuttle Challenger accident established pursuant to Executive Order 12546 dated February 3, 1986. The Task Force is established in accordance with NMI 8621.1D and is directed to proceed with the analysis of the facts, circumstances, and design issues surrounding the accident in accordance with the then existing plan and personnel. The purpose of this memorandum is to finalize Task Force membership and responsibilities and establish the powers and responsibilities of the Task Force Chairman.
2. Task Force membership is as set forth in Attachment A.
3. The Task Force is responsible for the following:
(a) Determine, review, and analyze the facts and circumstances surrounding the launch of STS Mission 51-L.
(b) Review all factors relating to the accident determined to be relevant including studies, findings, recommendations, and other actions that have been or may be undertaken by the program offices, field centers, and contractors involved.
(c) Examine all other factors which could relate to the accident including design issues, procedures, organization, and management factors.
(d) Utilize the full required technical and scientific expertise and resources available within the NASA institution and those which are or can be made available to NASA.
(e) Document Task Force findings and determinations and conclusions derived therefrom.
(f) In accordance with procedures established jointly with the Presidential Commission, provide information and documentation to the Commission regarding all the above or any other aspect of Task Force activities.
4. The Chairman of the Task Force is delegated the following powers and is assigned the following responsibilities:
(a) Establish such procedures for the organization and operation of the Task Force as he finds most effective; such procedures shall be part of the Task Force records.
(b) Establish procedures to assure the execution of his responsibilities in his absence.
(c) Direct or require the conduct of special tests or additional research as needed in support of the investigation.
(d) Designate such subgroups, teams, representatives, consultants, experts, liaison officers, observers, or other individuals, as required to support the activities of the Task Force. Their duties and responsibilities shall be included as part of the Task Force records.
(e) Coordinate the activities of the Task Force with the Presidential Commission in accordance with procedures established by the Commission.
(f) In coordination with the NASA Director of Public Affairs develop a policy for the appropriate review and dissemination of information to the public concerning the Space Shuttle Challenger accident and the activities of the Task Force.
(g) Advise the Administrator concerning the organization, procedures, operations, and findings of the Task Force, and its associated activities as required.
5. All elements of NASA will cooperate with the Task Force and provide full support within their areas of responsibility.
6. By separate action, I am directing the Associate Administrator for Space Flight, consistent with the final report of the Presidential Commission, to undertake through the regular Office of Space Flight organization such reviews, studies, and supporting actions as are required to develop recommendations to me on corrective measures to be taken prior to the next STS mission with respect to hardware, operational procedures and other aspects of the STS program.
William R. Graham
Acting Administrator
[N5] ATTACHMENT A
The following personnel are appointed to memberships on the 51-L Data and Design Analysis Task Force.
- Rear Admiral Richard H. Truly, Chairman (Associate Administrator for Space Flight)
- Mr. James R. Thompson, Vice Chairman (NASA Headquarters)
- Mr. Robert Crippen (NASA Astronaut, JSC)
- Col. Nathan Lindsay (Commander, AF Eastern Space and Missile Center)
- Dr. Joseph Kerwin (Director, Space and Life Sciences, JSC)
- Dr. Walter Williams (Special Assistant to the NASA Administrator)
- Mr. Thomas Lee (Deputy Director, MSFC)
- Mr. Clay McCullough (Manager, Support Equipment and Logistics Office, JSC)
- Mr. Thomas Utsman (Deputy Director, KSC)
- Col. Robert Bourne (Director, AF Space Shuttle Operations, VAFB)
- Mr. Alton Jones (Director of Flight Assurance. FSFC)
- Mr. John Thomas (Manager, Spacelab Program Office, MSFC)
- Mr. Tommy Holloway (Chief, Flight Director Office, JSC)
- Mr. Harold Draughon (Manager, Mission Integration Office, JSC)
Mr. Edward F. Parry (Chief Counsel, KSC) will serve as Legal Counsel to the Task Force. Mr. Jay F. Honeycutt (Deputy Manager of Operations and Integration Office, JSC) will serve as Task Force Staff Officer in NASA Headquarters.
Attachment 2
GENERAL ASSIGNMENTS FOR PHOTO AND TV SUPPORT TEAM
The Photo and TV Support Team shall perform as a priority task the end to end 51-L Mission Photography and Video products analysis. The results of these analyses are to be documented and provided to the four Task Force teams that have Commission Panel counterparts. These results will be designed to assist these teams in their efforts to respond to the needs and interests of the Commission. All photographic and TV products will be cataloged, analyzed, and documented.
This Team will serve as the focal point for all of the task force efforts concerning photography and TV including any required enhancement areas.
All requests for photographic and TV products will be handled by this Team. The other Task Force Teams will forward their tasks for photographic and TV data to this team for action.
The Team will assist the Commission panels as required with proper coordination with the interested Task Force Team.
The Team will establish a total photographic and TV plan for support of the task force and commission efforts.
Reporting will be in accordance with Task Force procedures and as required by the Task Force Chairman or Vice Chairman.
Figure 1 shows the organization of the Photography and Television Support Team in relation to the STS 51-L Data and Design Analysis Task Force. The figure also lists the number of full-time personnel involved at the NASA Centers and at other processing and enhancement facilities.
|
AGC |
automatic gain control |
|
APU |
auxiliary power unit |
|
BET |
best estimate of trajectory |
|
CAD |
computer-aided design |
|
CCD |
charge coupled device |
|
CCR |
camera control repeater |
|
CTC |
camera timing and control |
|
CZR |
ribbon frame cameras |
|
DCU |
decimal counting unit |
|
DEMUX |
demultiplexer |
|
ECC |
emergency camera control |
|
EIU |
engine interface unit |
|
EPRCO |
Exxon Production Research Company |
|
ET |
external tank |
|
ETR |
Eastern Test Range |
|
FM |
frequency modulated |
|
FR |
firing room |
|
FSS |
fixed service structure |
|
GMT |
Greenwich mean time |
|
GMTLO |
lift-off in GMT |
|
GPC |
general-purpose computer |
|
GUCP |
ground umbilical carrier plate |
|
HPFTP |
high-pressure fuel turbopump |
|
HDP |
holddown post |
|
Hz |
Hertz |
|
IRIG |
Inter-Range Instrumentation Group |
|
IGOR |
intercept ground optical recorder |
|
IFLOT |
intermediate focal length optical tracker |
|
IEA |
integrated electronics assembly |
|
JPL |
Jet Propulsion Laboratory |
|
JSC |
Lyndon B. Johnson Space Center |
|
KSC |
John F. Kennedy Space Center |
|
[N6] LC |
launch complex |
|
LCC |
Launch Control Center |
|
LED |
light-emitting diode |
|
LIPS |
Library of Image Processing Subroutines |
|
LMSC |
Lockheed Missiles and Space Corporation |
|
LOA |
launch operations area |
|
LOV |
limit of visibility |
|
LPS |
launch processing system |
|
MCC |
Mission Control Center |
|
ME |
main engine |
|
MEC |
master events controller |
|
MET |
mission elapsed time |
|
MIGOR |
mobile intercept ground optical recorder |
|
MILA |
Merritt Island Launch area |
|
MLP |
mobile launch platform |
|
MPS |
main propulsion system |
|
MSFC |
Marshall Space Flight Center |
|
MTU |
master timing unit |
|
MUX |
multiplexer |
|
NC |
normally closed |
|
NIP |
network interface processor |
|
NO |
normally open |
|
NPIC |
National Photographic Interpretation Center |
|
ODRC |
Orbiter Data Reduction Complex |
|
OMS |
orbital maneuvering subsystem |
|
OTV |
operational television |
|
PA-DD |
photographic acquisition-disposition document |
|
PAO |
Public Affairs Office |
|
PCM |
pulse-code-modulation |
|
PDL |
Ponce De Leon |
|
PIC |
pyrotechnic initiator capacitor |
|
PM |
phase modulated |
|
PPS |
pulse-per-second |
|
PSF |
pounds per square foot |
|
PRD |
Program Requirements Document |
|
PTCR |
pad terminal connection room |
|
RCS |
reaction control system |
|
RF |
radio frequency |
|
RSS |
rotary service structure |
|
ROTI |
recording optical tracking instrument |
|
RGA |
rate gyro accelerometer |
|
RSLS |
redundant set launch sequencer |
|
RZ |
return to zero |
|
SOP |
software operation program |
|
SRB |
solid rocket booster |
|
SRM |
solid rocket motor |
|
SSME |
Space Shuttle main engine |
|
STS |
Space Transportation System |
|
T-0 |
time of mission start, SRB ignition command |
|
TCC |
tracker control cabinet |
|
TDRS |
tracking and data relay satellite |
|
TMS |
trend monitoring system |
|
TSM |
tail service mast |
|
TTU |
timing terminal unit |
|
TV |
television |
|
TVC |
thrust vector control |
|
UCS |
universal camera sites |
|
USAF |
United States Air Force |
|
VAB |
vehicle assembly building |
|
VAST |
Visual Analysis Support Team |
|
WPAFB |
Wright Patterson Air Force Base |
V. PHOTOGRAPHIC, VIDEO, AND TELEMETRY DESCRIPTION AND ANALYSIS.
A. INTRODUCTION
This section of the report provides the combined summary results of the photographic analysis teams from the Lyndon B. Johnson Space Center, the John F. Kennedy Space Center, and the Marshall Space Flight Center. Included in this section is a description of the photographic and video systems in place at KSC and the enhancement analysis systems used by the JSC and MSFC photographic analysis teams. The STS 51-L integrated timeline is included. It was developed utilizing the JSC and MSFC evaluation teams in conjunction with the photographic teams at the three Centers. The timeline depicts the events as derived from the available telemetry and photographic data. The special analysis section provides the summary results of the analysis performed on selected photographic data which support the analytical and testing effort being performed by the primary task force teams.
B. SYSTEMS DECRIPTION.
1. Photo-Optical System Description
This section briefly describes and outlines the operational capabilities of the launch operations area (LOA) photo-optical system used at KSC. The subsystems that make up the LOA photo-optical system are listed in the following table.
|
LOA Photo-Optical System | |
|---|---|
|
. | |
|
|
|
|
. | |
|
LC-39A Launch Control Center |
|
|
LC-39A pad, fixed service structure, and perimeter |
|
|
Mobile launch platform (MLP) |
|
2. Launch Complex 39/B/MLP-2 Photo-Optical Description
a. Background
The Launch Complex (LC)-39 photo-optical system was conceived in the early days of the Apollo Program in 1963. During the intermediate years of the mid-sixties, the systems design evolved, and installation was complete for the first of the Saturn V launches. The system was an advanced state-of-the-art system at the time.
Although many elements of the system have been upgraded over the years due to unavailability of original parts, and to take advantage of obvious equipment advances, the system is basically the same system.
Since the Shuttle vehicle and ground systems configurations are entirely different from that of the Apollo, the camera locations are different. This is much more apparent around the proximity of the launch mount than it is at the perimeter camera sites.
Photographic coverage of the Shuttle launch vehicle has been implemented per requirements in the Program Requirements Document (PRD) and supported per the Photographic Acquisition-Disposition Document (PA-DD) by the Photographic contractor.
The cameras, environmental housings, most of the mounting hardware, blast covers, and close-in trackers are basically unchanged and have been highly successful thus far in the Shuttle Program.
[N7] b. Photo-Optical System Functions
One of the most important functions of photo-optical systems is to obtain contingency data, particularly to support detail studies of complex event development, and to detect anomalies.
The LC-39 Pad A and B photo-optical system is designed to command and control the remote operation of an extensive array of engineering and documentary film cameras.
Image data are obtained during prelaunch, flight readiness firing, and launch operations for the study and analysis of ground and flight vehicle systems performance.
Engineering applications include high-speed photography of events such as rocket engine ignition sequences, vehicle release mechanisms, mechanical displacements, and vehicle position and attitude during lift-off.
A wide variety of photographic analysis is performed such as detection and identification of flying debris, physical condition of external surfaces, and correlation of lift-off sequences. In addition to the engineering applications, the system also provides a wide variety of still, rapid sequence, and motion picture cameras for press release, multi-media audiovisual applications, and historical record.
c. Outline Description of System
The system control is located in the Launch Control Center (LCC), and incorporates the capability of sequencing up to 160 cameras on each launch pad, including the Mobile Launcher Platform, and the Fixed Service Structure (FSS).
At T-3 minutes, the sequencer is activated and initiates an independent parallel countdown to the Launch Processing System (LPS) countdown, with hold and resume count capability.
At the programmed times, camera start signals are multiplexed and sent to the launch pad, where they are demultiplexed and combined with camera running power and time correlation signals. Distribution to individual cameras is made through repeaters which are centrally located near major camera sites.
d. System Support Subsystems
In addition to the cameras, the system is composed of all the associated hardware and equipment such as mounting pedestals, platforms, brackets, and includes special plates, wedges, and adapting devices.
Also included in the support subsystems are the service cables, purge lines, environmental housings, blast covers, pan-and-tilt units, and dovetail quick-release mounts. Remote controls for close-in tracking of initial flight are also a part of the system.
The major equipment in the control system includes patch panels, timing terminal units, camera control repeaters, system sequencer, emergency camera controls, purge panels for safety and window purge multiplexer and demultiplexer (mux and demux) units, data modems, and camera control cabinets.
e. The 51-L Photo-Optical System Configuration
(1) Perimeter Sites
Figure 2 shows an aerial view of Pad 39-B showing perimeter camera sites.
Figure 3 shows a typical Perimeter Camera Site, specifically Site 4. The figure has been provided for a better understanding of the detailed site data contained in tables 1 through 5.
Figure 4, a general view of an LC-39B Perimeter Camera site is included to show the relationship of the camera locations contained in tables 1 through 5 to the Shuttle vehicle. The camera locations are relative to the vertical axis of the external tank in the launch position.
There is no Site 5 due to the presence of the slide wire installation.
Table 6 shows the displacement of each camera location from the site bench marks shown in tables 1 through 5.
(2) Fixed Service Structure and MLP-2
The cameras located in the Fixed Service structure and MLP-2 are precisely located on figures 5 and 6. Table 7 provides the viewing angles and coordinate locations for each of these cameras with reference to the X and Y axes of the external tank in the launch position.
f. Engineering Description of the System
A detailed engineering description of the LC-39 photo-optical system is provided as an appendix to this report.
2. Tracking Camera Coverage
Shuttle photographic tracking coverage utilizes a series of cameras located outside the pad perimeter which provide coverage from prior to ignition until after SRB separation or until LOV (Limit of Visibility).
Also, at ignition, cameras are started at three off-complex IFLOT (Intermediate Focal Length Optical Tracker) tracking mounts. These mounts are located at Universal Camera Sites (UCS) north, west and south of the launch pad at distances of 3 to 7 miles. These mounts have 16mm and 70mm cameras for coverage of early flight. Although they do provide coverage at lift-off, the lenses are not in proper focus until the vehicle has reached an altitude of approximately 1200 feet. Another mount located 3 miles southeast of the pad provides 70mm coverage of lift-off through the roll maneuver for broadcast-release television.
The long-range tracking instruments are mounted on mobile trailers or stationary units and are linked to the ETR radar and ranger computer. They are identified by type of mount:
These instruments utilize 35mm or 70mm cameras coupled to lenses with focal lengths ranging from 100 to 500 inches. These lenses are auto-focus and temperature compensated. The locations of the cameras are shown in figure 7.
Coverage by these instruments is from first-acquisition until LOV. Two mounts are located north and two mounts south of the flight line at distances of 6 to 40 miles. Two of these mounts (one north, one south) track the Orbiter after SRB separation. The other two mounts track the SRBs after separation until LOV.
All of the above cameras are dedicated to viewing structural integrity, propulsion performance and possible flight anomalies of the launch vehicle during daylight hours (sunrise plus 45 minutes, sunset minus 45 minutes).
In the event of a launch being scheduled beyond this daylight period, exposure levels are adjusted to "flame exposure," thereby providing coverage of the propulsion plumes.
In addition, all tracking coverage is dependent upon weather conditions and cloud coverage at time of launch.
3. Video System Description
a. Requirements
The design criteria for the pad B MLP-2 and MLP-3 operational television (OTV) systems were defined by station set 81 and the pad A and MLP-1 OTV systems design. MLP-2 was to duplicate MLP-1, and MLP-3 was to duplicate MLP-2. The pad B OTV system was to duplicate the Pad A OTV system except for minor physical site differences.
b. Definition of System
The LC-39 OTV system provides visual observation of prelaunch and launch activities as seen by strategically located television cameras at pad A, pad B, the Orbiter processing facility, the Vehicle Assembly Building, and on the mobile launchers. These television cameras are equipped with pan-and-tilt units and with variable focal length zoom lenses (16mm to 320mm) that are remotely controlled via a digital control system from the LCC. The video signals are transmitted to the LCC over air dielectric coaxial cable with 10 television channels frequency-modulated (FM) and band-stacked (frequency division multiplexed) on each coaxial cable. At the LCC, these FM carriers (90 channels per pad) are demodulated and routed to a 192 x 512 video routing switcher for distribution to firing rooms and other user monitors. Selected television cameras are routed to a recording facility where 25 recorders/players record and play back in accordance with user needs. The OTV system consists of the following system/subsystems:
- (1) Cameras
- (2) Pan-and-tilt units
- (3) Cabling system
- (4) FM transmission system
- (5) Switching system
- (6) Monitoring system
- (7) Digital control system
- (8) Record system
c. Capabilities
The combined OTV subsystems provide the following capabilities:
|
(1) Black-and- White TV Cameras | |
|
Resolution: |
750 TV lines |
|
Sensitivity: |
Full output with scene illuminations from 20 foot-candles to full sunlight. |
|
Standard: |
RS170 525-line interlaced scanning |
|
. |
|
|
(2) Modulators/Demodulators (RF system) | |
|
Modulation: |
Frequency modulation |
|
Bandwidth: |
6 MHz (450 lines TV resolution) |
|
. |
|
|
(3) Video Distribution | |
|
Bandwidth: |
10 MHz (750 lines TV resolution) |
|
. |
|
|
(4) User Monitors | |
|
Resolution: |
600 TV lines |
|
. |
|
|
(5) Color TV Cameras | |
|
Resolution: |
300 TV lines |
|
Sensitivity: |
Full output with scene illuminations from 20 foot-candles to full sunlight. |
|
Standard: |
American "NTSC" |
|
. |
|
|
(6) Recorders | |
|
Resolution: |
260 TV lines |
|
Standard: |
3/4-in. U-Matic |
These OTV subsystems combined into a "system" providing TV coverage with a maximum of 450-TV-line resolution for pad black-and-white cameras and 280-TV-line resorption for Public Affairs Office (PAO) broadcast color TV cameras. This resolution is sufficient for broadcast and for day-to-day operational viewing; however, it falls far short of that required for detailed analysis in the event of a problem.
OTV camera placements are shown in figures 8 through 12. TV systems are also located in the Vehicle Assembly Building and in the Orbiter processing facility. Views are documented in OTV document KSCL-3420-021, Rev. 0, dated April 24, 1985.
[N18] 4. Enhancement Systems
In addition to the usual viewing equipment such as light tables and projectors, digital image processing systems were employed on selected image frames by JSC, MSFC, and several government and industry organizations. Such systems provide image digitization, image data management, image mensuration, integrated computer-aided-design (CAD) and image processing of various types, and image display including color photography and animation on video tape. Each selected frame was appropriately processed to enhance or measure features of interest, with specific analysis techniques selected from general capabilities such as are indicated in figure 13. An overview of the JSC and MSFC digital image processing system hardware and software is given. The other government and industry organizations employed in enhancement and analysis also are listed in Section V.D.8.
The JSC digital image processing system is represented by the diagram in figure 14. An Eikonix model 850 linear array film digitizer with color and black-and-white capabilities was used. A Gould IP 8500 color image display and real-time disk allows evaluation of image quality, provides image data management, and supports image analysis through two image terminals accessing a modified Library of Image Processing Subroutines (LIPS). This system also provides video digitizing. A DEC Microvax II processor is the host computer system. Disk space of 786 megabytes and 9 megabytes of memory are available as well as a DECNET network interface. CAD manipulation capability allows measurement of size, location, shape, relative motion, and other features. Three engineering CAD systems were employed at JSC to generate automatically views of the stack from the camera's viewpoint. The JSC image processing system has both video and photo outputs.
MSFC used two networked image processing systems in parallel for image file transfer. Figures 15 and 16 show block diagrams of the two systems (subsequently referred to as IP1 and IP2). Both interface with the International Imaging Systems (IIS) model 600 hardware/software package for interactive image analysis and display. Both systems also have identical video input/output systems for processing and recording digital imagery on video tape and making a photographic hardcopy.
IP1 at MSFC is supported by a VAX 11/730 central Processing unit and serves as the primary system for image digitization and display. An Optronics model 4500 is the primary tool used to digitize film products, but an Eikonix CCD film digitizer is sometimes used for quick-look analyses. In addition, a Perkin Elmer microdensitometer is used to digitize selected frames at higher spatial resolution. Color and black-and-white capabilities exist on all three digitizers. IP2 is supported by a VAX 11/785 central processing unit and serves as the primary system for integrating image processing functions with CAD/CAM engineering files. IP2 supports concurrently the Intergraph Engineering Design Station (with image display capability) and the IIS model 600 image processing system. Disk space of 1.2 gigabytes and 16 megabytes of memory are used to support file management of image and design data and to provide sufficient central processing speed for numerical calculations.
V. C. INTEGRATED TIMELINE.
1. Introduction
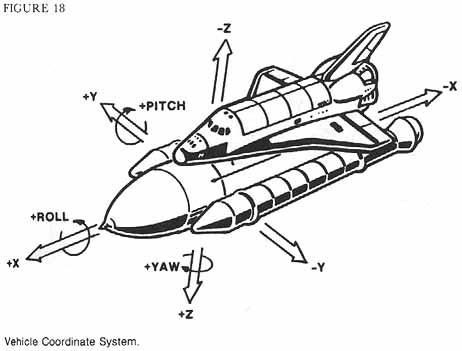
The events listed in the timeline (figure 17) are derived from two major independent data sources: telemetry and photography. The significant ascent events start with Solid Rocket Booster ignition and end with SRB destruct. A common vehicle coordinate system used for both photographic and telemetry events is shown in figure 18. Event times listed in this report are given in mission elapsed time, with SRB ignition defined at 028:16:38:00.010 Greenwich mean time (GMT).
a. Telemetry Events
The telemetry events include some key expected ascent occurrences such as Space Shuttle main engine (SSME) throttle commands to 104 percent, 94 percent, etc. These are listed for reference purposes only and in no way represent deviations from the normal. They are marked by an asterisk (*) in the timeline.
Data from two telemetry systems were used to identify telemetry events. The systems can be differentiated by the event measurement numbers "V", "T", and "B" series numbers (example V41P1300C) for the Orbiter, and "E" series numbers (example E41M3076D) for the SSME's. A description of each measurement or telemetry event and its sample rate, if applicable, is included.
Time applied to Orbiter telemetry data is derived from the onboard Orbiter master timing unit (MTU) time which is synchronized with GMT prior to launch. The onboard MTU time is included in the Orbiter downlinked telemetry bit stream and is downlinked at 10 samples/second with the data. The event times are adjusted for all known delays within the Orbiter telemetry to within the tolerance indicated on the timeline. The tolerance listed with each time indicates that the event occurred as first observed by this sample, but due to the nature of sampled data, may have actually occurred within one preceding sample period.
Unlike the Orbiter, the onboard MTU time is not telemetered with the engine data. Instead, a counter for each engine resets after the engine start command is validated by each engine controller. The GMT of the individual engine start commands is then used to time tag the engine data frames. The time uncertainty listed with each engine event includes the uncertainty associated with the engine counter reset as seen in the telemetered data as well as the sample rate of the measurement. Sequential events for engine performance measurements are known to a much greater accuracy.
All times are listed in both GMT and MET which is referenced to T-0 as identified by the SRB ignition command.
The raw data source for all the telemetry vents is either the Space Shuttle main engine 60-kilobit (kb) data from each engine or the Orbiter downlinked 192-kb bitstream (128-kb data + 64-kb voice) as recorded at the Merritt Island Launch Area (MILA) ground station. Data tapes recorded at both MILA and Ponce de Leon (PDL), the official range sites, have been examined on a telemetry frame-by-frame basis to extract the last usable data.
b. Photographic Events
Photographic events are identified by MET and the camera number. The time listed in the timeline for each photographic event is the time of the center of each film frame and the tolerance is derived from the camera frame rate. All launch film was reviewed, and the camera identified for each event is the camera on which the event first appears. Timing notes, time, and film speed are as follows:
(1) Cameras 202, 204, 206, 207, and 216: Timing is marked on the film and is film-frame referenced. Therefore, the onset of the observed event is considered to have occurred between the first frame in which it is seen and the preceding frame ( + 0 frame, - 1 frame).
(2) Camera 230: Time is recorded on every other frame. The onset of the observed event is considered to have occurred between the frame in which it is first seen and the previous frame.
(3) Camera 203: Film does not have a time frame reference recorded and therefore results in an uncertainty of plus or minus one-half frame. The onset of the observed event is considered to have occurred between the frame in which it is first seen and the preceding frame ( + 0 frame, -1 frame), for a total inaccuracy of + 1/2 frame, -1 1/2 frames.
[N20] (4) Cameras E8, E9, E60 and E63: Film does not have a time frame reference recorded and therefore results in an uncertainty of plus or minus one frame. The onset of the observed event is considered to have occurred between the first frame in which it was seen and the preceding frame ( + O frame, - 1 frame), for a total inaccuracy of + 1 frame, - 2 frames.
(5) Camera CZR-1: Camera CZR-1 time is marked on the film. Therefore, the onset of the observed event is considered to have occurred between the first frame in which it is seen and the preceding frame ( + O frame, - 1 frame).
(6) Camera D67: Film is not time-coded, and film frame rate is variable between 4 to 5.5 frames/second. The camera also skews its look angle upward after lift-off. Time estimates have been made utilizing the launch tower as a reference for measuring T-O.
(7) Film Speed and Accuracy: The film speed and accuracy are shown in the following table:
|
Camera |
Frame Rate |
Accuracy |
|
. | ||
|
E8 - 16mm |
400 frames/sec |
+ 0.0025, - 0.0050 |
|
E9 - 16mm |
400 frames/sec |
+ 0.0025, - 0.0050 |
|
E60 - 16mm |
100 frames/sec |
+ 0.010, - 0.020 |
|
E63 - 16mm |
100 frames/sec |
+ 0.010, - 0.020 |
|
E202 - 70mm |
30 frames/sec |
+ 0.0, - 0.033 |
|
E203 - 80mm |
30 frames/sec |
+ 0.16, - 0.049 |
|
E204 - 35mm |
45 frames/sec |
+ 0.0, -0.022 |
|
E206 - 70mm |
40 frames/sec |
+ 0.0, -0.025 |
|
E207 - 70mm |
40 frames/sec |
+ 0.0, -0.025 |
|
E216 - 16mm |
48 frames/sec |
+ 0.020, - 0.040 |
|
E230 - 35mm |
70 frames/sec |
+ 0.0, -0.014 |
|
CZR-1 - 140mm |
30 frames/sec |
+ 0.0, - 0.033 |
|
D67 - 35mm |
4 to 5.5 frames/sec |
Not applicable |
[N25] The location of the cameras and their look angles is specified in figure 19.
2. Events
Each event listed in figure 17 is shown with the data and/or photography which describes the event. The event numbers correspond to the numbers shown in figure 17.
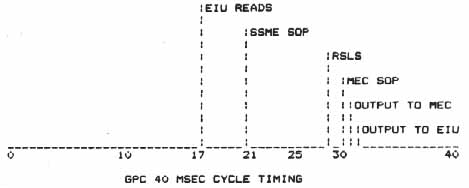
The SSME and SRB ignition signals are a result of software flags which are generated in the redundant set launch sequencer (RSLS). For the SSME's, the flag is interpreted by the SSME software operation program (SOP) and sent to the engine interface unit (EIU). For the SRB's, the flag is interpreted by the master events controller (MEC) SOP and sent to the SRB ignition pyrotechnics. All of the times are referenced from an expected time of lift-off (GMTLO, V99W8801C) that was sent from the launch processing system to the RSLS. The RSLS subtracts the GMTLO value from its current value for GMT; this difference is the high-frequency executive read of GMT completed 54 milliseconds prior to the start of the 40-millisecond cycle in which the RSLS is running and checks to see if the difference is less than 6.600 seconds. On the first pass that the criteria is satisfied, the software flag for main engine 3 start command is set. The calculation of this difference is not made again, and the last value is held in the telemetry stream (V90W8380C). The timing is such that 6.600 seconds after this time, the software flag is set by the RSLS for the MEC SOP to fire the SRB ignition pyrotechnics.
Forty milliseconds after setting the software flag for SRB ignition, the RSLS logic sets a flag for T-0 umbilical-release fire commands. The MEC SOP translates this into a command to the MEC for T-0 umbilical release. The MEC splits this input into T-0 umbilical release and holddown-bolt pyrotechnics fire commands which leave the MEC 40 milliseconds after the SRB ignition pyrotechnic fire commands had left. Following the 40-millisecond cycle, the RSLS sets a flag to reset the MEC and then terminates operation.
The E8 camera is stationary and is located on the mobile launch platform. It views the right SRB aft skirt and holddown posts from prior to ignition until after launch. At 00.008 second MET, the pyrotechnic initiator capacitor (PIC) firing is indicated by a small smoke puff from the dome of the frangible nut. On the top photo (figure 20), the first indication of this smoke is difficult to see without a frame-by-frame analysis. Also, the shadow obscures the smoke. The bottom photo is taken approximately 0.040....
[N26] ....second later, and shows that the smoke is clearly visible although somewhat obscured by the shadow cast on the holddown post.
Figure 21 shows the first continuous vertical motion of the vehicle as the booster lifts from the pad and the luminous exhaust plume from the Solid Rocket Booster becomes prominent.
(4) Confirmed Smoke Above Field Splice Initially Moves in + X Direction
Immediately after solid rocket motor (SRM) ignition, dark smoke is observed billowing out from between the right SRB and the external tank. The exact location of the smoke source is not viewed directly. Visual analysis and image enhancement of film from five camera locations have been used to determine the approximate origin of the smoke in space and time, to characterize the dynamic behavior of the smoke, and to determine its longevity.
The consensus opinion of the film interpreters is that smoke is first discernible at 00.678 second MET from camera E60. It becomes visible on other cameras shortly thereafter; figure 22 presents views from two cameras showing the first evidence of the smoke. Based on these and other cameras, the smoke appears to be dark in color (brownish-gray under strong illumination and....
The time relationship of the general-purpose computer (GPC) outputs to the EIU and master events controller to the run time for the softwater modules (RSLS, SSME, SOP, and MEC SOP) in the GPC 40-millisecond cycle are shown in the following:
[N27] ....nearly black when shadowed) and is first seen above the aft to aft-center segment field splice as shown on the computer-aided design drawing of figure 23. The smoke appears to move upward in the + X direction in the next few frames after it first appears.
Figure 24 presents the viewing angles of all of the cameras which observed the smoke, and figures 25 through 27 provide examples of the views from several of these cameras. The crosshatched area of the CAD drawing in figure 28 shows the region of the smoke origin determined to be between 270 degrees and 310 degrees clockwise from the + Z axis toward the ET.
During the first few seconds after lift-off, the smoke appears to exhibit multiple puff characteristics. After an initial upward movement of a particular mass of smoke, the motion of the vehicle causes that mass to trail off rearward relative to the vehicle. A new puff of smoke is evidenced when another mass of smoke with relative upward movement compared to the previous puff is seen.
Figures 29 through 31 present photographs of the smoke during this time. Figures 32 through 34 show motion analyzer plots (graphic depictions of the events as measured from the film) of the smoke cloud behavior from 02.064 seconds MET to 02.266 seconds MET. Figures 32 and 33 show the rearward motion relative to the vehicle of a particular puff of smoke. Figure 34 shows the development of a new puff in relation to the earlier one. Figure 35 shows the relative motion of the top of the smoke in relation to a fixed reference. Smoke motions indicative of separate puffs are marked on the figure and have been identified beginning at the following times:
Since the point of origin of the smoke is not visible to the cameras, it is not certain that these separate puff motions are due to a pulsating source of smoke. Harmonic vehicle motions resulting from the lift-off ~twang" could possibly account for some of the observed motion.
The CZR-I camera was used to determine the last positive evidence of smoke above the right aft SRB/ET attachment ring because the detail in the picture allows accurate identification of the SRB structure. The E60 camera photograph from a similar viewing angle and time offers corroborating evidence. Both photographs are shown in figure 36.
With increasing upward velocity of the vehicle, the smoke is dispersed below the vehicle. The last positive visual indication of the smoke as it disperses below the ET aft dome is seen on camera E60 at 03.375 seconds MET. Figure 37 shows this event along with a view from camera E217 at approximately the same time. The smoke is difficult to distinguish from the plume gases and can be tracked only by performing frame-to-frame visual analysis. After this time in flight, the vehicle motion, the ET aft dome insulation outgassing, and the vehicle plumes combine to make observation of smoke difficult, if not impossible. No definite evidence of smoke can be confirmed at any time after 03.375 seconds MET.
Right SRB - 21.604 second
Photography from cameras E203, E207, and E216 was used to identify the location of the first flame. The flame origin was estimated to be 315 degrees ( + 10 deg) clockwise from the + Z axis of the SRB towards the ET and near the aft field joint. This estimate was produced by the use of an image analysis system. Figure 44 with a CAD overlay shows the earliest detection of the flame on E207 at 58.762 seconds MET.
Figure 45 shows the first evidence of flame on the right SRB. This is only one frame later than the enhancements could detect.
Figure 46 shows the visual evidence of flickering. The top photo shows the flame at 59.087 seconds MET while the flame is not apparent in the bottom photo taken at 59.112 seconds MET.
Image enhancements by various organizations detected the leak at 58.762 seconds. Verification that flickering was seen directly (not as a reflection) was confirmed by the fact that brightness levels remained constant in other presumed reflection areas. The flickering was characterized by maximum, average, and minimum intensities versus time, and by frequency analysis.
Figure 47 is a composite of a sequence of 40 frames from camera E207 (printed with Orbiter oriented at top of stack) and shows the growth of the plume from 58.762 seconds MET through 59.661 seconds MET. The white boxes outline the location of the plume. The intermittent nature of the plume is observed. Fluctuations in intensity can be seen between 58.788 seconds MET and 59.262 seconds MET. At 59.262 seconds MET, the plume becomes well established and continues to grow, although some variation in intensity is still evident.
Figure 48 depicts the flame without any background data or reflections. This was accomplished by electronically subtracting the image with no flame visible (frame 20 of figure 48) from frames 21 to 59. The maximum brightness level of these resultant images is plotted in figure 49. Figure 50 shows a power density spectrum....
...of the maximum intensity of the flame from the right SRB. The dominant frequency of the flickering is every fourth frame which corresponds to a pulse rate of 10/sec.
(21) Reconstructed Maximum Dynamic Pressure (720 psf)
The maximum dynamic pressure in pounds per square foot (psf) was derived using the lift-off + 10 minutes rawinsonde wind data and the best estimate of trajectory (BET) (see figure 51). The maximum value of 720 psf occurred at 59.000 seconds MET.
The flame became a continuous well-defined plume at 59.262 seconds MET, although it continued to vary in intensity as shown in figure 52. The CAD drawing gives the approximate location of the flame source.
Several image analysis techniques were employed to ascertain the origin of the plume on the right SRB. Figure 53 shows a frame from camera E207 at 59.487 seconds MET with CAD overlay. Figure 54 shows a frame from camera E-216 at 59.507 seconds MET registered with the appropriate CAD drawing. The flame origin was estimated to be at 45 degrees ( + or - 10 degrees) from the + Z axis of the right SRB toward the ET and near the aft field joint.
The first evidence of flame as shown in figure 55 is seen from the south at Melbourne Beach at 59.753 seconds MET, almost a second later than it can be seen from the north. This view is slightly out of focus because the camera was focused for the nominal SRB separation distance.
(24) SRB Chamber Pressure Divergence (Right Hand Versus Left Hand)
The start of the SRB chamber pressure divergence (right versus left) was defined using measurement B47P1302C for the left SRB chamber pressure and B47P2302C for the right SRB chamber pressure. The measurements used have a 12.5-sample/second sample rate which corresponds to an accuracy tolerance of 0.080 second. The time of the event was established using measurement B47P2302C at the second data sample of the flat chamber pressure (see figure 43). The established event time for the right SRB is 60.004 seconds MET.
As the plume from the side of the right SRB increased in size, it was impinging on the external tank and deflected by aerodynamic forces. The plume deflection was intermittent. The first evidence of the plume deflection through visual analysis is at 60.238 seconds MET and is best seen first from camera E207 (see figure 56). A second photograph from camera E207 taken 0.223 second later shows the deflection of the plume more clearly. (See figure 57).
Figure 58 shows a view of the vehicle from almost directly aft with only parts of the SRB's and ET visible. The vehicle is difficult to identify because the film is exposed for plume characteristics. However, the anomalous plume is very prominent. Visual analysis shows that the growing plume arcs around some 60° of the external tank structure at the 2058 ring frame. The location was verified by using an image analysis system to overlay CAD drawings on the images. The first frame on which this event can be identified is from camera E203 at 60.248 seconds MET, but the event is better depicted from the same camera at 60.614 seconds MET.
Continuous deflection of the plume is first apparent on camera E207 at 60.988 seconds MET as shown in figure 59. From this time, the plume grows rapidly, eventually obscuring the lower section of the ET, as depicted on the annotated CAD drawing.
[N44] (28) Start of Left SRB Thrust Vector Control Rock Actuator Spike
The start of the left SRB thrust vector control actuator spike was taken from measurement B58H1150C (see figure 60). This measurement has a sample rate of 25 samples/second which results in a time tolerance of 0.040 second. The event time selected, 62.094 seconds MET, is the data point defining the maximum rock actuator negative position prior to loss of data.
(29) Right-Hand Outboard Elevon Actuator Hinge Moment Spike
The right-hand outboard actuator hinge moment spike was defined using the right outboard elevon primary differential pressure I measurement (V58P0966C). The first data point depicting the peak of the actuator hinge moment spike was selected. The measurement has a 12.5-sample/second sample rate with an accuracy tolerance of 0.080 second. The selected time of the right-hand outboard actuator hinge moment spike peak was 62.484 seconds MET (see figure 61).
(30) Right-Hand Outboard Actuator Differential Pressure Change
The right-hand outboard elevon actuator differential pressure change was defined using measurement V58P0966C, which is the right outboard elevon primary differential pressure 1. The first data point indicating the unexpected change in right-hand elevon differential pressure was selected. The measurement has a 12.5-sample/second sample rate with an accuracy tolerance of 0.080 second. The time of the right-hand outboard elevon actuator differential pressure change was 63.924 seconds MET (see figure 61).
(31) Start Vehicle Pitch-Rate Change
The start of the vehicle pitch-rate change was defined using measurement V9OR2525C, which is the left SRB pitch rate. The first data point which reflects the start of the vehicle pitch-rate change was selected to establish the time of the event. The pitchrate change measurement has a 5-sample/second sample rate with an accuracy tolerance of 0.2 second. The start time of the vehicle pitch-rate change was 64.604 seconds MET (see figure 62).
An abrupt change in the shape of the anomalous plume occurs at 64.660 seconds MET and is the first indication of a hydrogen leak. This change is shown in figure 63. This leak is corroborated by changes in the ET hydrogen pressurization system beginning at 66.674 seconds MET.
Within .045 second after the abrupt change in the anomalous plume, a bright sustained glow is noted on both the + Z and -Z side of the ET. This is shown in figure 64 as viewed from the south side of the vehicle.
(34) Start Main Engine Large Pitch Variations
The start of the main engine large pitch variations is defined by measurement V68H11OOA, which is the main propulsion system (MPS) engine 1 pitch-actuator position. The data point selected to establish the time of the event is the first point that...
...reflects the start of the main engine large pitch variations.
This measurement has a 25-sample/second sample rate with an accuracy tolerance of 0.04 second. The selected time of the start of the main engine large pitch variations was 64.937 seconds MET (see figure 65).
...25-sample/second sample rate with an accuracy tolerance of 0.04 second. The time of the pitch/roll gimbal rate was 72.497 seconds MET.
V95H0185C-X-component of current Shuttle position vector
V95H0186C-Y-component of current Shuttle position vector
V95H0187C-Z-component of current Shuttle Position vector
V95L019OC-X-component of current Shuttle velocity vector
V95L0191C-Y-component of current Shuttle velocity vector
V95L0192C-Z-component of current Shuttle velocity vector
V95W0200C-Time tag associated with current state
These are all 1-sample/second measurements and the time selected was 72.624 seconds MET. This event is a normal ascent event to be used for reference only and corresponds to the last state vector downlisted prior to the incident.
Left SRB (636 psi) 73.044 seconds MET
Right SRB (612 psi) - 73.044 seconds MET
This frame (see figure 74) shows fluid streaming from the ET hydrogen tank aft barrel area. The aft barrel failure is suspected to have begun at this time.
At 73.137 seconds MET, an arc of vapor occurs along the interface between the ET hydrogen tank and the intertank structure as shown in figure 75. The appearance of the vapor suggests a structural failure of the intertank area.
[N52] After the initial onset of vapor from the intertank area, the vapor cloud increases in intensity and volume, flowing alongside the ET between the intertank and the aft dome (see figure 77).
Analysis of film from camera E204 and the NASA Select video shows a flash from the region between the Orbiter and the ET liquid hydrogen tank with the apparent center (based on CAD analysis) at the Orbiter midbody (see figure 78). The view from camera E207 showing the right side of the vehicle indicates a significant area of radiance between the aft dome and the intertank. The flash seen from viewing the left side of the vehicle is a probable result of the forward propagation and enriched burning of the SRB exhaust products in the separated flow region caused by the anomalous SRB plume and the release of hydrogen from the aft liquid hydrogen tank failure.
Camera E204 viewing the left side of the vehicle indicates a flash near the SRB forward attach (intertank) area and a brightening of the flash between the Orbiter and the ET (see figure 79). A view of the right side of the vehicle from camera E207 shows a significant increase in the volume of the recirculated hydrogen-enriched SRB exhaust products as a result of freestream flow blockage induced by the anomalous SRB plume and the rapidly increasing release of hydrogen from the aft liquid hydrogen tank failure. The flash near the SRB forward attach area is potentially the circumferential propagation of the radiant SRB exhaust products due to aerodynamic effects and structural failure of the intertank area.
This view of the left side (figure 80) of the vehicle shows the start of the major structural failure of the liquid oxygen tank. A small intense flash occurs just ahead of the SRB forward attach and grows into a large, extremely bright spherical shaped flash in succeeding frames.
The white flash increases in intensity as it grows to its maximum size (see figure 81) and then decreases over the next 100 or so milliseconds. This intense white flash is attributed to the failure of the liquid oxygen aft dome/intertank.
The HPFTP discharge temperature on main engine 1 (ME-1) has exceeded its upper limit and met the requirements of the main engine (ME) controller for an engine shutdown. The shutdown event is identified as ME-1 Phase-In-Effect (E41J1512B) which occurred at 73.543 seconds MET (see figure 83). The event is confirmed by a preponderance of ME-1 parameters.
The status of the data processed during this time interval on an Orbiter minor-frame-by-frame basis is presented in figure 85. Each frame of Orbiter data is 10 milliseconds in length. Near the beginning of each frame following frame synchronization, a data word appears listing the status of a counter in the telemetry system which indexes one count each 10 milliseconds. A raw data dump was utilized to observe the synchronization and frame count for the last data frame. This frame ends at 73.631 seconds MET.
The event has been verified by correlation with the groundrecorded automatic gain control (AGC) signal from the S-band FM receiver.
The data tape from the Ponce de Leon station was also processed as described and the signal as received at this ground station ended within 2 milliseconds of the time selected.
A bright flash in the vicinity of the Orbiter nose is evident after the Orbiter emerges from the ET vapor cloud as seen on figure 86. A distinctive reddish brown cloud is evident and suggests that the forward RCS propellant lines failed and that overboard spillage of the RCS oxidizer and fuel resulted in an abrupt hypergolic reaction.
Figure 87 shows the nose cap separating from the SRB. At 76.686 seconds MET, the drogue chute starts to deploy approximately parallel to the SRB axis as seen in figure 88.
Range safety destruct of the right SRB is evident in figure 89. This time correlates with the time at which the destruct signal was sent.
Range safety destruct of the left SRB is evident in figure 90.
3. Evaluation Data Source And Telemetry Data Processing
The engineering telemetry data reviewed by the Orbiter systems personnel were generated from the data recorded as received at the MILA ground station. Initially, data were processed from tapes produced by the network interface processor (NIP) at Mission Control Center (MCC) from the data transmitted to Houston in real time. The real-time data received initially at MCC were also supplied to the trend monitoring system (TMS) facility which provided data for a quick-look data scan at a reduced sample rate. Subsequently, the MILA-recorded data was replayed into the MCC from the MILA site with all data quality validation criteria removed in order to recover the maximum quantity of data during the final fractions of seconds when the data were deteriorating. NIP tapes of these data were processed into final data products (i.e., plots, tabulations, strip charts) by both the Orbiter Data Reduction Complex (ODRC) and MASSCOMP facilities and provided to the system analysts.
Both the MILA and PDL raw data tapes were later sent to Houston and examined to verify that all available data had been processed. A raw data dump from the MILA data tape was provided to enable the last 450 milliseconds of data to be viewed during the time of the deteriorating data. The last recoverable data frames (by operational instrumentation minor frame number) processed automatically were 56, 57, 58, 81, 84, 88, 89, 92, 99, 0, 1, 2, 3. Each data frame is 0.010 second long. The last recoverable data frames containing valid synchronization and frame count were 59, 60, 70, 72, 82, 85, 90, 97, 4. Data from these frames were extracted manually and validated as described in event (63). The first break in the automatically processed data frames occurred after frame 58 at 73.161 seconds MET. Frame 4, the last frame containing valid synchronization and frame count, ended at 73.631 seconds MET (figure 85).
All data processed through the ODRC and MASSCOMP facilities have been time corrected for delays within the telemetry system with the exception of GPC data. The GPC data staleness has been verified to be within the sample period of the measurement for all measurement sampled at higher than 1 sample/second.
The events defined by the 1-sample/second measurement listed in the official timeline have been verified to have occurred within one sample period.
V.D. SPECIAL ANALYSES.
This section of the report provides the results of specific photographic analysis which were accomplished during the STS 51-L incident investigation.
1. Closeout Photo Analyses-STS 51-L Right-Hand Aft Field Joint
A special analysis effort was undertaken to use digital photographic enhancement methods to extract as much information as possible from the closeout photos taken during mating of the STS 51-L aft-center segment to the aft segment on the right-hand SRB.
After installation of the two O-rings in the clevis, approximately 12 closeout photographs were taken around the joint, showing the primary and secondary O-rings and other features of the clevis. These pictures were examined to determine if any damaged or defective areas existed in the O-rings or if any contamination existed on the O-rings. The pictures for the right-hand aft field joint were not of engineering quality and little could be determined by direct inspection of the prints.
However, an interesting thickening of the dark space between the upper surface of the secondary O-ring and the lower edge of the land was noted, together with notable streaks in the same area (figure 91). This print was digitized and enhanced, and the thickening of the dark space was measured. Results indicated a gradual thickening of about 0.015 inch and a decrease to about 0.006 inch within about 0.5 inch length (figure 92). This data suggested a possible O-ring defect.
The original negative was obtained and digitized and enhanced. Much more detail about the gradual thickening of the dark space was present in the original negative. The upper edge of the dark space was now found to contain two abrupt discontinuities which are faithfully mapped to the lower edge of the dark space, indicating that what was observed was a shadow of irregularities in the grease on the lower edge of the land (figure 93).
A project was also started to see if the original picture could be replicated with an O-ring defect of the size suggested by the thickening of the dark area. O-rings were distressed to match the suggested defect, and the photographic arrangement was reproduced. The O-rings were greased and installed in a portion of a clevis joint, in accordance with normal field joint installation procedures. The defects were obvious without enhancement of the photograph (figures 94 and 95).
Questions had been voiced regarding the small streaks seen in the same area, both on the O-ring and on the land. It was believed that such small structures could not be formed in the grease while following the standard field joint O-ring installation procedures (surgically gloved hands, no use of the brush after the grooves were greased, etc.). Such small-scale detail was easily generated with the surgically gloved hand. Ridges of 0.005 inch were readily made, and, with heavier coats of grease, grooves or ridges of 0.020 inch characteristic height were formed (figure 96).
Examination of the digitized, enhanced pictures for all the closeout photographs (using duplicates of the original negatives) revealed only one additional artifact, a horseshoe-shaped feature, somewhat resembling a crater (figure 97). Reasonable replicas of this feature were constructed in the grease patterns using normal procedures as detailed above (figure 98). Therefore, this feature was considered to be a grease pattern, not a contamination item.
2. Vehicle "Twang"
In support of the investigation of the vehicle response, to SSME ignition, the so-called vehicle "twang," a special analysis was conducted to measure the deflection of the ET nose tip. This tip deflection was measured from film E79 using the motion analyzer. Figure 99 shows the measured tip deflection for STS 51-L, and figure 100 compares this tip deflection with those measured on the last two launches of the Challenger. No anomalous motions are observed during this analysis.
3. Pad Photographic Results
The following are the significant results as determined from review of the pad photographic and video systems.
a. Facility Hydrogen Vent Arm Retract Latchback Failure
Launch film from camera 41 shows that the gaseous hydrogen vent arm does not firmly latch when retracting at T-0 (see figure 101). Postlaunch inspections confirmed the latch failure (see figure 102). The inspections of the latch system also revealed no immediate explanation as to why the arm and ground umbilical carrier plate (GUCP) failed to latch back. Significant inspection findings are as follows:
- 1. The vent arm was hanging slightly off centerline (approximately 2 inches south).
- 2. The deceleration cylinder had been partially stroked.
- 3. Vent line appeared to have a slight amount of twist.
- 4. Trunnion stud (launch pin) was broken and nut was missing.
- 5. Static lanyard was not tangled around the latchback bar.
Review of all launch film and OTV data shows that the arm does not escape the capture envelope that the facility structure provides. Moreover, this review gave no indication of the vehicle passing more closely to the gaseous hydrogen vent arm than observed on previous launches. Launch film data excludes two cameras that are normally dedicated to view the latchback mechanism since the facility modifications had not been completed to allow for installation of these cameras.
Sufficient data exists to exclude facility hydrogen vent arm retract latchback failure as a contributing factor to the STS 51-L incident. There is insuffficient OTV/film data to define the cause of the latchback failure exactly.
b. Liquid Oxygen T-0 Umbilical Carrier Plate Excursions
The motion of the liquid oxygen plate during SSME thrust build-up was measured from film item E21 and plotted in X-Z vehicle coordinates. Figure 103 shows the excursion of the liquid oxygen carrier plate as recorded in film item E21.
This measurement shows the change in carrier plate static position due to cooling and weight redistribution effects of cryogenic loading.
No anomalies were noted in the direction, amplitude, or significant event times associated with the liquid oxygen T-0 umbilical carrier plate excursions from SSME ignition through carrier plate first motion at 16.38:00:106 GMT. The LO2 carrier plate excursions in the X and Z directions are shown in figure 104.
c. Ice Debris Observations from Launch Film Review
All launch film has been closely reviewed for ice/frost debris, which was evaluated for any possible contribution to the STS 51-L incident. A typical ice condition before launch on the FSS is shown in figure 105.
In general, pad- and MLP-level cameras observed ice falling from facility areas, ice/debris items traversing on the MLP deck level, and particles being blown upward from exhaust holes. The effect of aspiration into the SRB and SSME exhaust holes can also be seen by these cameras. The launch film data review shows no indication of any ice/debris impact damage to the Space Shuttle vehicle that may have contributed to the STS 51-L incident.
Those cameras that were viewing the Orbiter surfaces and the SSME and orbital maneuvering system (OMS) engine nozzle areas showed aft RCS covers and SRB thermal curtain tape being dislodged, as well as FSS/RSS ice falling. Nozzle oscillations, loose tile-gap filler, chips from base tiles, and umbilical ice particles are typical observations. A camera with a southwest vantage point at the MLP deck level showed evidence of black smoke as the right SRB aft skirt clears the frame. Large dark smoke puffs from the right SRB were noted shortly after T-0. None of these cameras document any ice/debris associated with the dark smoke area.
Those cameras viewing the SRB aft skirt, hold-down posts, and blast cover areas showed ice particle translation at the MLP....
....deck level. One camera documented particle aspiration toward the SSME exhaust hole. A piece of water system shim-like material was observed moving upwards and falling to the MLP deck. SRB thermal curtain tape was observed to be loose in several places on the aft skirt. Water was seen coming out of stiffener rings on both SRB's. Ice particles from the over-pressure water trough area were observed having upward translation. Some ice was observed traversing toward the Orbiter wing/tail service mast (TSM) area. Water trough and cardboard-like material was observed coming out of the SRB exhaust hole area. A piece of debris and a smoking/smoldering particle were observed having upward translation at vehicle lift-off.
Cameras viewing the hold-down posts showed fragments and frangible nut pieces coming out of the SRB aft skirt/hold-down post attachment-bolt hole. These particles are seen traveling into the exhaust hole and disappearing into the exhaust smoke. The hold-down post blast covers appear to close normally. When the post-launch inspection determined that the four kick spring/plunger assemblies were missing from the holdpost blast covers, an in-depth film review was performed. Blast cover position for kick spring/plunger assembly escape was determined.
Careful analysis of film data did not show any upward moving debris from the hold-down post vicinity when the blast cover position would allow escape of the kick spring/plunger assembly.
The cameras viewing the facility TSM T-0 umbilicals documented normal operation with little frost.
The cameras located on the fixed service structure show large amounts of ice breaking loose from the FSS and falling soon after SSME ignition (see figure 106). Some ice particles appear to be in excess of one foot in length. The smaller ice particles are observed to travel very close to the Orbiter left wing surfaces and hit the left SRB aft booster/aft skirt surface. A camera documented about 12 objects coming out of the SRB exhaust holes or off the MLP deck during vehicle ascent. Ice/frost is seen coming off the ET-Orbiter umbilicals. Numerous large debris objects are observed in the exhaust plume after the vehicle clears the FSS.
The cameras that view the gaseous hydrogen vent arm documented little frost coming off at retraction. The disconnect and drop appear normal. One camera showed the vent arm failing to latch back firmly at retraction, but showed no subsequent damage because of the failure.
Those cameras viewing from the pad perimeter sites document....
....FSS/RSS ice falling (see figures 107 and 108), and those cameras viewing from northern vantage points show smoke from the right SRB at T-0. Typically, no additional debris is seen in these films until the vehicle clears the pad (debris in exhaust plume).
d. STS 51-L Launch Area Fluid Discharge
Review of camera E79 film indicated a dark oily-type fluid coming from behind an "I" beam and kick plate adjacent to the ET gaseous hydrogen vent line pivot point at 220-foot elevation. The fluid began discharging prior to SSME startup and continued through T-0.
The probable source of this fluid was water discharging from the 220-foot elevation Firex nozzle and impinging on the inboard kick plate. The film also indicated a small amount of dark fluid discharging from the next lower Firex nozzle.
During a post-launch pad walkdown, two residual material samples were collected from this area and submitted to the Failure Analysis Laboratory. The Laboratory results are shown in the following table:
Dark stain a-d
Light stain
.
Sand
SRB Residue
Iron Oxide
Zinc Primer
Kaolin Type Clay
Sand
(Aluminum Silicate)
Aluminum Paint
Aluminum
Titanium Paint
Iron
-
Zinc
-
Notes:
- a The water deluge system operated a minimum of 2 hours after launch prior to shutting down.
- b Samples were collected on 316186.
- c Analysis was performed on particle size of less than 20 microns.
- d Limited sample submitted to Laboratory did not allow for weight percent composition.
[N68] As indicated by the following Laboratory Report, petroleum compounds were not present in the samples. The samples mainly consisted of sand, rust and paint deposits. Based on this analysis, the dark fluid observed was contaminated water.
As a result, it is recommended that the water deluge system be drained and flushed on a regular basis to remove all water contaminants that are a possible hazard to the Orbiter.
SUBJECT: Wipings on Lint Free Cloth
LABORATORY REQUEST NO.: MCB 180-86
1.O FOREWORD.
1.1 REQUESTER: R. Stevens/NASA/SE-MSD-21/7-0806
1.2 REQUESTER'S SAMPLE DESCRIPTION: Wipings from FSS near hydrogen vent arm at pad 39-B, Postlaunch 51-L.
1.3 REQUESTED: Determine substances on lint free cloth
2.0 CHEMICAL ANALYSIS AND RESULTS.
2.1 Very small particles (less than 20 microns) were removed from the cloth and examined by scanning electron microscopy with the energy dispersive spectroscopy method. Only a very few, tiny particles of typical iron corrosion products, sand, aluminum oxide, zinc primer and miscellaneous organics (containing silicon) were observed.
2.2 The wipes were rinsed and analyzed by infrared spectroscopy for organics. The soiled areas yielded kaolin-type silicate which the non-soiled area did not.
2.3 The amounts of material were so small that
weights could not be made (relative to the cloth that the stain was
on) therefore, only a qualitative analysis can be reported. If
quantitative analysis is desired, clean filter papers should be used,
weighed before and after sampling, and as much material should be
collected as possible.
e. Film Analysis of Hold-down Blast Shields
Post-launch inspection of the hold-down posts revealed that the kickspring assemblies on hold-down posts M-3, 4, 7, and 8 were missing from the blast shield installations (see figures 109, 110, and 111). Therefore, a detailed analysis of engineering film items E27 and E28 was performed to establish a timeline of the operation of the blast shields. Figure 112 shows the relation of cameras E27 and E28 to hold-down posts M-3 and M-7.
The main objective of the analysis was to determine from the performance of the blast shields the exact time period in which the kickspring assemblies were mechanically prevented from leaving the installed location.
The corollary objective was to determine the "worst case" (earliest) time period in which the kickspring assemblies could have become detached.
Figures 113 and 114 provide plots of the angular displacement of the blast shields on hold-down posts M-3 and M-7 as measured on film items E27 and E28, respectively.
The curves are annotated with a line of demarcation at 57 degrees. The area above the line shows the time period in which the kickspring assembly is mechanically "safe," since it is held in by the blast shield. The area below the line shows the time periods in which the kickspring assembly could mechanically come out if it were not additionally locked in by other means, such as the wire rope.
Figure 115 shows the relative location of the kickspring assembly and the lower inside surface of the blast shield that compresses the spring during lift-off.
The excursions of hold-down posts M-4 and M-8 blast shields cannot be measured with any degree of accuracy since they are viewed parallel with the plane of the motion.
However, it is evident that the dwell time and rate of closure approximated that of the shields on M-3 and M-7. (See tables 8 and 9.)
A rough attempt at quantifying the motion of the M-4 shield showed that the prelaunch static position of approximately 52 degrees actually measured 71 degrees. The 74 degrees maximum excursion angle appeared as 80 degrees, while the approximate angle of 40 degrees appeared as 70 degrees. Subjectively, the excursions of M-4 and M-8 appeared consistent with the excursions observed on M-3 and M-7, plus or minus a very few degrees.
Closures could not be determined because of flame obscuration, but appeared to occur within a few milliseconds of each other.
The relatively short dwell time and rapid closure rate observed on all four blast shields suggest that the kicksprings were in place and working until sometime after closure. However, this belief cannot be confirmed by direct observation.
No direct impingement of primary SRB flame is evident in the vicinity of the kicksprings throughout the observational interval of approximately 1.120 seconds. This fact would tend to support the hypothesis that the wire rope restraints were still intact.
Conversely, it is highly probable, based on known drift characteristics of the launch vehicle, that direct primary SRB flame impingement of a magnitude sufficient to burn off the wire rope restraints did occur after 1.120 seconds.
There is no evidence that the kickspring assemblies impacted the vehicle.
Table 8. Angular Displacement of SRB Hold-down M-3 Blast Shield (from Film E27)
Event
Excursion GMT degrees Elapsed time, sec .
Static position
53
16:38:00.018
0.0
First motion detected
53
16:38:00.331
0.313
Start kickspring capture
57
16:38:00.393
0.375
Start dwell at maximum excursion
74
16:38:00.657
0.639
Midpoint of maximum excursion
74
16:38:00.679
0.661
End of dwell
74
16:38:00.720
0.702
End of kickspring capture position
57
16:38:00.853
0.835
Blast shield in closed position
0
16:38:01.138
1.120
[N69] Table 9. Angular Displacement of SRB Hold-down M-7 Blast Shield (from Film E28)
Event
Excursion
GMT deg
Elapsed time, sec
.
Static position
52.5
16:38:00.019
0.0
First motion detected
52.5
16:38:00.338
0.319
Start kickspring capture
57
16:38:00.393
0.374
Start dwell at maximum excursion
74
16:38:00.683
0.664
Midpoint of dwell
74
16:38:00.703
0.684
End of dwell at maximum excursion
74
16:38:00.720
0.701
Last measurable closing position
69
16:38:00.827
0.808
End of kickspring capture (extrapolated from plot)
57
16:38:00.897
0.878
Next measurable closing position
33
16:30:01.077
1.058
Blast shield closed position
0
16:38:01.156
1.137
f. Investigation of MLP-2 Film Data Losses (STS 51-L)
An unusual number of photo-optical system cameras on the MLP-2 facility failed to generate required data during the launch of STS 51-L. Of the nine positions from which no usable film was obtained, two positions, L-1 (E1), and L-6 (E4) were crucial to the accident investigation, since these viewed from the north quadrant into the right SRB field joint area from which smoke was observed by other cameras during lift-off.
(1) MLP-2 Camera Configuration for STS 51-L
Figure 116 shows the general locations of the photo-optical system cameras on the MLP and the FSS. Figure 117 provides a detailed plan view of the full complement of MLP-2 photo camera positions (28) that were installed for STS 51-L.
The nine cameras that failed to produce data are identified as solid black symbols on figure 117.
Each camera on the MLP is installed in an environmental housing. This housing is purged continuously with dry nitrogen gas, which is fed from the pad 50-psi safety purge system, and each enclosure is held to a positive pressure of approximately 5 psi.
Each camera position, except the TSM positions where it is not needed, is equipped with a high-pressure window purge system fed by the pad 750-psi nitrogen system. In addition, all positions exposed to flame incorporate blast covers, which protect the cables, flex purge lines, and environmental housings from direct flame impingement.
(2) Post-launch Condition
The following paragraphs provide a description of the postlaunch condition of the failed items as reported by the photographic operations contractor quality assurance function.
(a) Position L-1 (Item E1)-Camera is located on the northeast corner of the, MLP deck and views the lower ET, SRB's, and Orbiter.
Camera jammed after a very short run (16 feet processed). Jammed film in camera showed that lower film loop was lost and film wound around the upper sprocket and bent the keeper into the film pull-down shuttle mechanism.
(b) Position L-6 (Item E4)-Camera is located on the northwest corner of the MLP deck and views the lower ET, SRB's, and Orbiter.
Jammed film after start. Jammed film was piled up and broken past the first sprocket; film in gate stripped and film piled up on upper sprocket. No film on lower loop.
(c) Position 0-2A (Item E23)-Camera is located on the south side of the MLP deck and views the + Y OMS engine nozzle.
Jammed film after start. Film shredded at lower sprocket numerous windings on upper sprocket and two layers of film in and out of first sprocket. No film remaining in gate.
(d) Position B-7 (Item Ell)-Camera is located on the MLP deck and views the left SRB northeast hold-down post (HDP) 7.
Short camera run-30 feet processed. Camera condition normal-i.e., no break in film or no jam noted. Apparent camera stoppage as if electric power cutoff.
(e) Position B-8 (Item E12)-Camera is located on the MLP deck and views the left-hand SRB HDP 5.
Film jam after short run (20 ft processed). Jammed film piled up on upper loop. Lower loop was lost.
(f) Position B-9 (Item E13)-Camera is located on the MLP deck and views the left-hand SRB southwest HDP 6.
Jammed film on start. Remaining film in gate contained stripped perforations. Film was piled up at lower and upper keepers.
(g) Position B-6 (Item E16)-Camera is located on the MLP deck and views the left-hand SRB skirt, sound suppression water troughs and left-hand lower Orbiter body flap.
Film break during start. No jam. Clean break at first sprocket. No film in gate.
(h) Position B-10 (Item E14)-Camera is located on the MLP deck and views the left-hand SRB northwest HDP 8.
Jammed film at start. Film jam after appropriately 2 feet-film jam on upper keeper, wound on top sprocket and pile-up between timing block and film gate. Section of film gate had torn perforations. Film broken prior to take-up flange.
(i) Position L-2 (Item E5)-Camera is located on the east side of the MLP deck and views the Orbiter right wing, body flap, and lower ET/SRB.
Jammed film on start. Remaining film in gate contained punched perforations, pile-up at lower sprocket.
(3) Brief Description of Cameras
All of the cameras used on the MLP close-in positions are Milliken models DBM-4, DBM-5, or in two locations Redlake model Lo-Cam. All locations except positions T-1 (E21), T-2 (E22),and L-2 (E5) which are 200 frames per second are operated at 400 frames per second.
The cameras are loaded with 200 feet of Eastman VND color film, and have an approximate running time of 20 seconds. The cameras were programmed to start at T-10, T-11, or T-12 seconds depending on the position. This start time allows the cameras....
Figure 118 shows the details of the type of camera movement involved in the Milliken cameras that dominate the MLP-2 installation.
Of importance are the loops where the film is tightly wound, which are the trouble spots in connection with film set and embrittlement.
The shuttle mechanism becomes involved in the failure mode because it must engage and pull down precisely one frame of film at a time, 400 times a second. The slightest back-up or hesitation in the film transport due to stiffness or film set causes the shuttle to miss the perforations and punch or tear the film, starting a jam or tear. This failure is not as probable in a camera that incorporates a register pin, but it can happen.
Film set can cause the sprocket teeth to miss one or more perforations if the set forms a bend (curl) opposite to the curvature of the path around the sprocket, and this problem can initiate a Jam.
Film set and embrittlement can cause film breakage even when the shuttle or sprockets engage the film in a normal fashion because the film is unable to absorb the dynamic loading of the acceleration during start-up and is unable to bend quickly around the sprockets without snapping apart.
(4) Analysis of Factors of Highest Probability
This section of the report deals with the identification and assessment of the known factors of highest probability that could have contributed to the film losses.
Three primary factors that are known to cause film set (film embrittlement and distortion) resulting in film breakage and jams, particularly in high speed cameras, were present to some degree during the launch preparations of STS 51-L.
These are (1) film threaded and sitting in the camera for an extended period to time, (2) film drying out due to low humidity, and (3) low temperature. Combined, the effect of these factors is additive and cumulative with time.
(5) Findings
Because of launch delays and recycling of the STS 51-L launch, the cameras sat on the pad with film loaded for approximately 72 hours, which was about three times longer than on a normal operation.
After 48 hours, the photographic operations contractor was allowed to re-enter the pad and turn the film through the cameras by hand. The purpose was to advance fresh film from the supply spool into the film gate area to minimize the possibility of film jams caused by film set.
During the entire 72-hour period, the film was subjected to the dehumidifying effects of the dry nitrogen safety purge, which flowed continuously through the environmental housings. This exposure undoubtedly maximized the embrittlement characteristics of the film for the given period of time.
In addition, the ambient temperature in the vicinity of the MLP was below freezing during the early morning hours preceding the launch.
(6) Assessment of the Factors
Although there has been much speculation concerning the impact of the low temperature conditions as being the leading cause of the film jams and breakages, the evidence suggests that the cold in combination with the dry gaseous nitrogen purge were the contributors.
First, the purge gas entering the camera housings on the MLP flows through the interior of the MLP. The lines are 1/4-inch stainless steel, and run along the ceilings of the compartments under the camera positions.
It is probable that these lines absorbed some heat from the interior of the MLP, and that this heat kept the cameras slightly above the outside ambient temperatures. The exact differential is not known.
It is considered improbable that the interior of the MLP or....
.....the gas flowing into the housings was freezing or below. There is little doubt, however, that the temperatures inside the camera housings were below the nominal 60 to 70 degrees needed to minimize film set characteristics.
Second, it is known that the absolute dryness of the purge gas creates an embrittlement problem with the film regardless of other factors.
It is probable that after "soaking" for approximately 72 hours in dry nitrogen, the film had reached its maximum dryness especially in the outer layers of the film supply spool and in the mechanism.
Finally, it is highly probable that in spite of the precautions taken by the photo operations contractor, the film that was advanced was already on the way to becoming brittle, and quickly "set-up" in the transport mechanism.
The one exception to the film jam/break failure mode is position B-7 (item E11). The failure mode of this position appears to be a typical case of an open circuit due to launch environmental wear-and-tear effects on service cables, etc. An analysis of this item has not been completed to the point that it conclusively does not have a bearing on the other failed positions.
(7) Factors or Anomalies Not Ruled Out
The pattern of camera locations of the items that failed does not appear to be a random pattern. The grouping of failed items cannot be rationalized on the basis of purely statistical rationale without reaching an extremely high improbability estimate.
It cannot be explained why the cameras on the MLP deck, which according to all evidence should have been in a more favorable environment than the cameras on the FSS, had a high failure percentage, while the FSS cameras had no failures.
The fact that the most important cameras, in terms of direct viewing of the critical event at lift-off, were among the failed items is only partially explainable as a random statistic. The percent of failed items to total MLP items is 32 percent. Of the nine failed items, four are considered most important as directly viewing the smoke event. The percent of critical items to failed items is 44 percent.
Other factors about which there is insufficient evidence to report will be the subject of continuing investigation.
(8) Factors Ruled Out as Failure Contributors
According to the system analysis that was conducted, all cameras received starts. Pre-launch and post-launch system validation tests were conducted and no deviations were noted. Additional evidence to confirm system operation is that two of the failed items were "Y"d from common wire pairs with cameras that obtained data.
The MLP-2 photo-optical system has no history of previous camera failures of a similar nature. In fact, the reverse is true in that the reliability of the MLP-2 photo-optical system has been extremely high.
The photographic operations contractor personnel are well qualified, have extensive experience with the system, and have adequate inspection and checkout procedures with supporting documentation.
(9) Interim Conclusion
In view of the physical evidence of film jams and breaks in the camera and confirmation of the adverse environmental conditions surrounding the cameras at launch time, it is concluded that a cause and effect relationship can be established. It is tentatively concluded, barring new evidence that may be developed, that it is highly probable (but not conclusive) that the data losses are attributable to the combination of extended time the cameras sat ready with film at the launch pad, dryness due to extended exposure to dry nitrogen purge, and lower than nominal temperature conditions. The one exception mentioned earlier concerning the open circuit is to be determined.
4. Leak Check Port Assessment
To support failure scenarios associated with a leaking or missing plug at the leak check port location, a special analysis was performed to determine if any smoke could be seen issuing from the leak check port location on the zero-degree (bottom centerline) position of the field joint between the aft and aft-center segments of the right SRB. Figure 119 shows the configuration of the leak check port. Figure 120 shows the viewing angles of cameras E60 and E63 which see the leak check port area. Figures 121 and 122 present smoke patterns which would be expected on these cameras if smoke was indeed issuing from the leak check port. Figures 123 and 124 show the location of the smoke as it develops during...
...the initial phase of the smoke buildup. These two figures were made on a film motion analyzer which graphically depicts the film events. As can be seen from the figures, the observed smoke patterns are totally inconsistent with smoke from the leak check port area. Thus, the determination was made that no smoke issued from the leak check port.
5. Structural Breakup Characterization
Analysis of visual and telemetered data has enabled a characterization of the structural breakup events associated with the loss of the Space Shuttle vehicle. The events began with the compromise of the right SRB case joint at lift-off. At about 60 seconds into the flight, this compromise was manifested by a burn through of the SRB which bathed the external tank with propellant burn products near the SRB lower attach fitting area. The burn through plume penetrated the external tank at approximately 65 seconds MET and caused liquid hydrogen to spill out. At approximately 72 seconds MET, the burn through plume caused loss of the lower attach fitting load path which allowed the SRB to begin a counterclockwise rotation around the upper strut area. The structural weakening of the external tank aft region led to the failure of the aft end of the hydrogen tank which dumped hydrogen into the base region and caused the loss of integrity of the Orbiter load path. This failure allowed the Orbiter to begin moving in relation to the external tank. A combination of (1) the effects of a sudden large forward thrust of the external tank caused by the expulsion of hydrogen from the aft end, (2) the possible contact of the right SRB at the forward attach area, and (3) the possible contact of the Orbiter in the intertank region caused a....
....massive structural failure of the intertank area including the liquid oxygen tank aft dome and liquid hydrogen forward dome. The violent decompression and vaporization of the liquids in conjunction with the aerodynamic loads and some fringe burning caused complete structural loss of the external tank and sent large amounts of external tank debris from the vapor cloud. The SRB's were seen exiting the vapor cloud and continuing to fly until range safety destruct.
The actual breakup of the Orbiter was almost entirely obscured from view by the vapor cloud. It is expected that aerodynamic loading in conjunction with SRB plume impingement as the boosters thrusted past the Orbiter were the main contributors to the Orbiter breakup. Many fragments are noted exiting the ET cloud; however, very few are readily identifiable. These few include the left wing and the crew cabin. The nonidentifiable fragments are noted tumbling and spinning against the background of the ET propellant cloud/SRB plume and occasional flashing of reflected light.
Depicted in figure 125 is an initial stage of the vehicle debris emerging from the ET cloud/SRB plume. The distinctive reddishbrown color of the nitrogen tetroxide oxidizer from the orbital maneuvering system and reaction control system propellants is observable in this figure. Visible in figures 126 and 127 are the crew cabin and the left wing intermingled with numerous small debris segments.
The black bands on the wing at the forward edge of the elevon panels (see figure 127) indicate that this is the upper surface- hence, the left wing.
Figure 128 shows the crew cabin descending nose forward with debris and an outgassing aft of the cabin at 89.452 seconds MET.
6. Post Structural Breakup Right SRB Characterization
A special analysis was undertaken to characterize the condition of the right SRB up to the point of range safety destruct in an attempt to determine the maximum size of the source of the flare (anomalous plume). Figure 129 shows the SRB immediately after it exists the vehicle breakup cloud. External tank hardward is visible still attached to the SRB and deflecting the flare. This deflection gives the impression that the entire aft segment has a burn through. As the SRB continues to fly away, its counterclockwise rotation and varying angle-of-attack cause the appearance of the flare to change drastically. When the flare is on the windward side of the SRB as in figure 130, the flare is blown back and wrapped around the vehicle and gives the impression of a large circumferential burn through. When the flare is on the leeward side of the SRB as in figure 131, the flare gases fill the separated flow area on the back side and give the impression of a large axial burn through. All of these impressions are caused by flowfield effects and are not true representations of the flare source. Recovery of the aft-center segment of the right SRB confirms the burn through location described in previous sections of this report (see figure 132). Figures 133, 134, and 135 show the recovered hardware.
The right SRB exits the cloud at approximately 75.8 seconds MET. The separated nose cap and deployed drogue parachute are observed at approximately 76.4 seconds MET. At around 80 seconds MET, a reflection off of the SRB recovery system remnants (drogue parachute and risers) is observed (and confirmed by enhancements) on the side of the SRB as shown in figure 136. This event was initially reported as a possible second anomalous SRB plume.
7. Review of Prior Flight Film
Film and video coverage of lift-off and ascent are routinely reviewed as part of the postflight mission evaluation. Typically, ...
....teams of 6 to 15 engineers and photo analysts study each film to search for possible anomalous events. Screening notes are routinely written for each film to document any findings. A review of these screening notes did not reveal any evidence of anomalous smoke or plume leakage on prior flight film.
Subsequent to the STS 51-L mission, film and video from previous missions were again viewed to search for any subtle evidence of smoke or vapors that were possibly overlooked in earlier viewings. Included within this rescreening were the liftoff coverages of the specific missions (STS-2, 41-B, 41-C, 41-D, 51-C, 51-A, and 61-C) in which postmission teardown inspection had revealed evidence of heat-induced O-ring damage in the SRB field joints. As the earlier screening had indicated, no evidence of anomalous smoke or plume was detected.
Several instances of apparent anomalous smoke or flame need to be clarified to avoid possible confusion in the future. On mission STS 51-B, a small wisp of white or gray vapor was observed in NASA Select Video above the + Z side of the left SRB aft attachment ring. A careful review of that event revealed that the vapor appeared about 8 milliseconds before SRB ignition and that it was most likely water mist abruptly blown around by the Space Shuttle main engine plume effects. Similar wispy vapors are also occasionally noted on the SRB stiffener rings where water tends to collect.
Also noted on a number of flights (41-D, 51-A, 51-C, 51-J, 61-B, and 61-C) are significant flames on the ET aft dome after T+90 seconds. This appearance of flames is caused by the recirculation of plume gases and ET insulation outgassing products into the vehicle base region. This outgassing and recirculation which occurs on all flights, is accounted for in the design of the vehicle, and is completely normal.
[N81] 8. Other Government and Industry Analyses and Enhancements
a. Initial Analyses
Several image analysis facilities, in addition to those at JSC and MSFC, were involved in the analysis of STS 51-L imagery. These remote facilities were:
National Photographic Interpretation Center (NPIC) U.S. Air Force (USAF) Wright Patterson AFB, Dayton, Ohio (WPAFB) Space Division, Los Angeles, CA Jet Propulsion Laboratory (JPL) Lockheed Missiles and Space Corporation (LMSC) ITEK, Inc. Exxon Production Research Company (EPRCO) Other government facilities.
These facilities were originally given the following tasks:
(1) Possible Smoke Puff-Analyze E207, frame 23 for possible existence of vapor that could be considered a precursor to the subsequent flare on starboard SRB (frame 42).
(2) Study of Early Development of Flare on Starboard SRB-Using E207 frames 35, 36, 42, 55, and 96, and E206 frame 131, characterize early development of flare, including time of initial flare, point of origin, orientation of flare, dimensions, and rate of growth. Assess direct visibility versus reflections from Shuttle components.
(3) Enhancement of Spatial Content of Scene-Using E206, frame 634, enhance resolution of entire Shuttle image and stretch contrast or perform other enhancement to improve ability to assess make-up and orientation of apparent vapor concentration around Shuttle, especially around belly of external tank. Also need to assess any apparent relative motion of Orbiter components.
(4) Enhancement of Apparent Vapor Patterns-Enhance E206, frames 634, 635, and 636 to show maximum information on apparent vapor patterns rapidly developing in vicinity of Shuttle.
(5) Physical Location of Bright Spot-Using E206, frames 635 and 636, determine location of bright reddish-orange spot. Is there any apparent change in position relative to the Shuttle between the two frames?
(6) Location of Origin of Bright Spot-Using E206, frame 639, locate origin of developing bright sport near forward tip of the external tank.
(7) Multi-Image Correlation of Flare Development- Using E206, frames 131 and 145 in conjunction with E207, frames 109 and 110, analyze conditions developing on starboard SRB that would explain initial visibility from the south (E206).
(8) Composition of Plume-Using data available from E60 and E63, assess the feasibility of determining spectral characteristics of the smoke plume, and if feasible, perform such analysis.
(9) Geometric Characteristic of Smoke-Using frames from E60 and E63, determine the best estimate of the point of origin of the smoke plume. Also include size, shape, location, and rate of growth. Note any other characteristics associated with plume.
The analyses were hampered in this initial stage (2 weeks after the accident) by the lack of suitable photographic materials to support digital analysis. All organizations reported problems in digitizing from the cut-film transparencies and most resorted to digitizing from 8 x 10 positive prints or abandoned the effort entirely. Exxon and one other laboratory had contact transparencies of E60 and E63 and performed analyses of the smoke at launch.
During this time period, Exxon concentrated on determining the time of origin of the burn through and in generating enhanced views of the sequence of events from 70 and 73 seconds MET, as viewed on E207. Exxon then concentrated on enhancements of photography pertaining to the puffs of smoke at launch.
JPL received contact positive transparencies of the 70mm film and performed a detailed analysis of the time of origin and development of the flare at initial burnthrough.
b. Follow-On Analyses
A follow-on effort consisted of performing task assignments, using better film and ancillary products, during the last week in February. The task assignments, based on updated interpretation of the focus of the investigation, as well as on assessment of each facility's strong points, as evidenced in their initial response, were as follows:
(1) National Photographic Interpretation Center
(a) Origin and Development of Flare-Using additional material (E203, E217, and E207 transparencies), determine time and location of the initial flare from burn through. Locate point on the SRB in both longitude and circumference. Characterize growth of flare projected into by X/Z and Y/Z planes, and characterize apparent progression of origin around the circumference of the SRB. Include roll/frame numbers as well as time of specific events.
(b) Characterization of Normal Reflection from Shuttle-Using Intergraph capabilities demonstrated in initial response, generate simulated views of the Orbiter stack as it would appear during a nominal launch, with emphasis on reflections from all known sources of light (i.e., left and right SRB plumes, main engines, and Sun). If task is feasible, the requirement is for a view from each camera location (E207, E204, E217, and E203) for every 10-second interval launch or camera acquisition until launch + 70 seconds. This task would require, for example, only two views E207, those being at 57 seconds and 67 seconds MET.
(2) USAF-Wright Patterson AFB (WPAFB)
(a) Detect and quantify motion of right SRB relative to other Shuttle components-Using photo materials and ancillary data, analyze for evidence of motion of the right solid rocket booster with respect to the other Shuttle components. Telemetry evidence suggests that the right SRB broke loose from at least one aft attachment point at approximately 72.5 seconds MET. At some point in the subsequent explosion, the right SRB obviously became completely separated and proceeded through the debris cloud. Any information on the relative attitude of the right SRB to the rest of the Shuttle stack as a function of time would be useful.
(b) Analysis of Right SRB after Explosion-Describe the motion and structural abnormalities of the right SRB after separation from the STS 51-L stack; i.e., Orbiter, SRB's, and ET. Where possible, describe motion in pitch, roll, and yaw. Analyze the imagery to determine size and location of burn through area(s) in the SRB. Locate the burn through area(s) on a CAD/CAM. Use photographs from E207, E206, and E204 to accomplish this task.
(3) USAF-Space Division
(a) Development of Flare from Burn Through-Use appropriate frames from E207, E206, E217, E204, and E203 to determine time and location of the initial flare.
Locate point on the SRB in both longitude and circumference. Define growth of flame projected into the X/Z and Y/Z planes, and characterize the apparent progression of origin of flame around the circumference of the SRB. Identify if and when the flame first impinges on the external tank. Is there any evidence of a hydrogen leak from subsequent burn through of the ET? If so, describe the time and development. This analysis is essentially a rerun and expansion of previous analysis, with additional source material.
[N82] (b) Cause and Effect Analysis of Explosion-Analyze available imagery and ancillary data from launch through explosion and develop cause and effect scenario to explain the chain of events visible in the imagery. In lieu of a complete scenario, individual observations of features or events that would be significant in a cause and effect investigation would be helpful.
(c) Analysis of Right SRB after Explosion-Describe the motion and structural abnormalities of the right SRB after separation from the STS 51-L stack; i.e., Orbiter, SRB's, and ET. Where possible, describe motion in pitch, roll, and yaw. Analyze the imagery to determine size and location of burnthrough area(s) in the burn through area(s) on a CAD/CAM. Use photographs from C207, E206, and E204 to accomplish this task
(4) Lockheed Missiles and Space Corporation
(a) Development of Flare from Burn Through-Use appropriate frames from E207, E206, E217, E204, and E203 to determine time and location of the initial flare. Locate point on the SRB in both longitude and circumference. Define growth of flame projected into the X/Z and Y/Z planes, and characterize the apparent progression of origin of flame around the circumference of the SRB. Identify if and when the flame first impinges on the external tank. Is there any evidence of a hydrogen leak from subsequent burnthrough of the ET? If so, describe the time and development. This analysis is essentially a rerun and expansion of previous analysis, with additional source material.
(b) Characterize Smoke at Launch-Using data from CZR-I, E60, and E63, characterize development of the puff of dark smoke between the starboard SRB and the ET shortly after T-0. Try to define origin and time of first emission. Note that Shuttle stack is oriented with + Z axis north. Sun would be illuminating the space between the SRB and ET from the Orbiter side thus, a shadowing effect could be evident before actual visibility of the smoke. For reference, time of interest on E60 begins at about frame 1200, with smoke visible in the frame 1235 to 1240 region. Maximum visibility is near frame E60/1350.
(c) Cause and Effect Analysis of Explosion-Analyze series of imagery just before and during explosion and develop cause and effect scenario to explain the chain of events visible in the imagery. In lieu of a complete scenario, individual observations events that would be significant in a cause and effect investigation would be helpful.
(5) Jet Propulsion Laboratory
(a) Using frames from E207 centered on time 66.464 seconds MET, characterize the development of the plume. In particular, determine if secondary plume is originating from ET and represents liquid hydrogen or gaseous hydrogen. Determine if hydrogen is burning. Use film from other cameras V.D.8.b.(5)(b) to help in this analysis; i.e., E203, E217, and E204.
(b) Using CZR-I, E60, and E63, determine location or origin of smoke puff present on SRB immediately after lift-off.
(c) Continue development of SRB plume from frame 160 of E207 to point of explosion. Review film to determine if every fourth frame is needed or if less frequent interval would be sufficient. Define when plume impinges on ET.
(6) ITEK, Inc.
(a) Time and Origin of Burn Through-Using the appropriate frames from rolls E207 and E203, determine the time and location (on the SRB) of the first burn through. Characterize the orientation and rate of growth until flare is visible from the south on E204.
(b) Growth of Split in Right SRB-Determine radial extent of burn through on the right SRB as a function of time. Use available data before and after the explosion to determine initial growth rate shortly after burn through and the maximum extent evident at the time the right SRB disappears into its own plume shortly after drogue chute deployment.
c. Results
The results of these follow-on analyses were received in the mid-March to early-April timeframe and generally have not been analyzed and consolidated for this report. The findings do, however, generally corroborate the integrated timeline events when the analyses pertain to a particular event.
A summary of available results from the other government and industry analysis and enhancement efforts is contained in the following tables (10 through 17).
NPIC enhancements and CAD analyses provided data used to differentiate the developing flare from normal reflections. NPIC generated a CAD model of the external tank and solid rocket boosters and showed a view similar to that seen by E207, emphasizing reflections of light cast by the opposite SRB plume (figure 137). Evidence that a bright spot, as viewed by E207, is a reflection is supported by uniform brightness levels in the sequence of false color images (figures 138 and 139). The brightness of hypothetical reflections (small arrows on the enhancements) remains constant between frames 23 and 109. By contrast, the flare on the opposite side of the SRB (large arrow on enhancements) increases significantly during the same timeframe. This convergence of evidence, using computer models and enhanced photography, was valuable in characterizing the time and origin of the first burn through.
|
Report |
Date |
Camera |
MET |
Description |
|
. | ||||
|
KNSC |
3/21 |
E60 |
0.669 |
First indication of smoke-visual inspection. |
|
EPRCO |
2/25 |
E60 |
0.638 |
First indication of smoke using image enlargement and contrast stretch. |
As examples of the work done at the remote laboratories, figures 137 through 139 have been included.
NPIC enhancements and CAD analyses provided
data used to differentiate the developing flare from normal
reflections. NPIC generated a CAD model of the external tank and
solid rocket boosters and showed a view similar to that seen by E207,
emphasizing reflections of light cast by the opposite SRB plume
(figure 137). Evidence that a bright spot, as viewed by E207, is a
reflection is supported by uniform brightness levels in the sequence
of false color images (figures 138 and
139). The brightness of hypothetical reflections (small
arrows on the enhancements) remains constant between frames 23 and
109. By contrast, the flare on the opposite side of the SRB (large
arrow on enhancements) increases significantly during the same
timeframe. This convergence of evidence, using computer models and
enhanced photography, was valuable in characterizing the time and
origin of the first burn through.
[N84] Table 11 First Evidence of Flame on Right SRB
|
Report |
Date |
Camera |
Framea |
MET |
Description |
|
. | |||||
|
NPIC |
2/11 |
E207 |
23 |
58.761 |
"Light gray wedge shaped area deter-mined as a possible smoke puff appears to emanate from that same region. " |
|
JPL |
2/17 |
E207 |
23 or 24 |
58.761 |
"Frame 23 or 24 appears to be the first frame with a reflection of the flame." |
|
LMSC |
2/12 |
E207 |
23 |
58.761 |
"There is evidence in frame 23 (58.716) of a possible flame at that time which is not visible to the camera (i.e., it is bright enough to reflect off of the external tank)." |
|
LMSC |
2/12 |
E207 |
35 |
59.016 |
"Frame 35 (59.016 MET) showed the earliest evidence of a flame." ". . . the specular reflection assumption is probably incorrect." |
|
Other |
3/20 |
E207 |
12 |
58.486 |
"ET is illuminated by an apparent source located on the SRB but obscured from view." |
|
Other |
3/20 |
E207 |
23 |
58.761 |
"Flare is not yet visible." |
|
LMSC |
3/21 |
E207 |
25 |
58.811 |
Reflection |
|
LMSC |
3/21 |
E203 |
1189 |
58.814 |
Direct |
a Frame numbers were assigned at JSC to facilitate processing. Photographs should be referenced by camera and MET.
As examples of the work done at the remote laboratories, figures 137 through 139 have been included.
Table 12 Continuous Well-Defined Plume.
|
Report |
Date |
Camera |
Framea |
MET |
Description |
|
. | |||||
|
JPL |
2/17 |
E207 |
52 |
59.487 |
Brightness grows continually beginning with frame 52. |
|
Other |
3/6 |
E207 |
42 |
59.236 |
". . . obviously a flame in frames subsequent to 42." |
a Frame numbers were assigned at JSC to facilitate processing. Photographs should be referenced by camera and MET.
|
Report |
Date |
Camera |
Framea |
MET |
Descriptionb |
|
. | |||||
|
NPIC |
2/11 |
E207 |
23 |
58.761 |
1253 +/-73 in. |
|
NPIC |
2/11 |
E207 |
35 |
59.061 |
1232 +/-72 in. |
|
NPIC |
2/11 |
E207 |
36 |
59.086 |
1251 +/-73 in. |
|
NPIC |
2/11 |
E207 |
42 |
59.236 |
1272 +/-74 in. |
|
NPIC |
2/11 |
E207 |
55 |
59.561 |
1248 +/-73 in. |
|
NPIC |
2/11 |
E207 |
96 |
60.586 |
1258+/-73 in. |
|
LMSC |
2/12 |
E207 |
23-110 |
58.761 |
-. . . it appears the origin was within one foot of the segment seam." |
|
LMSC |
2/12 |
E207 |
23-55 |
58.761 |
". . . maximum B circumferential extent of the flare (134 deg., or approximately 14 feet)." "The growth stops at approximately 59.5 seconds." ". . . the origin location would be at about 23 degrees toward the external tank. " |
|
JPL |
3/17 |
E207 |
28 |
58.866 |
1488, 51.2 deg. toward ET. |
|
[N85] Other |
3/6 |
- |
- |
- |
1439/1453/Attachment ring. ". . . the source is obscured from view around the side of the SRB." "It is unlikely that the source is very far around from the visible surface." |
|
Other |
3/20 |
E207 |
12 |
58.486 |
Near lower attach strut-XB= 1696 |
|
Other |
3/20 |
E207 |
35 |
59.061 |
XB = 1657 + 12 inches; 52 degrees A from + Z toward ET |
|
Other |
3/20 |
E203 |
1233 |
60.281 |
"'Orientation of flame changes from frame to frame." From near the lower strut tangent to the ET. |
|
LMSC |
3/21 |
- |
- |
- |
"Close to the aft segment joint" (1491.56 inches.) |
|
LMSC |
3/21 |
- |
- |
- |
53 degrees + / - 6 degrees. |
|
USAF/WPAFB |
3/14 |
E207 |
27 |
58.861 |
0.338 inches + 50 inches. |
Table 14 First Evidence of Plume Deflection.
|
Report |
Date |
Camera |
Framea |
MET |
Description |
|
. | |||||
|
T-LINE |
3/14 |
E207 |
- |
60.238 |
First evidence of plume deflection intermittent. |
|
Other |
3/20 |
E203 |
1233 |
60.281 |
"'Orientation of flame changes f frame to frame." |
|
LMSC |
3/21 |
E203 |
1231 |
60.2 |
"First impingement." |
a Frame numbers were assigned at JSC to facilitate processing. Photographs should be referenced by camera and MET.
Table 15 First Evidence of Continuous Plume Deflection.
|
Report |
Date |
Camera |
Framea |
MET |
Description |
|
. | |||||
|
T-LINE |
3/14 |
E207 |
- |
60.988 |
First evidence of continuous plume deflection. |
|
Other |
3/20 |
E203 |
1247 |
60.748 |
"'Flame appears to wrap around the aft section of the ET." |
a Frame numbers were assigned at JSC to facilitate processing. Photographs should be referenced by camera and MET.
Under the assumption that the brightest image area shown at 58.886 seconds MET is indeed the direct image of the flame, the flame source location was identified by projecting a crosshair on the SRB surface at the projected source of the flame. The location identified on the SRB surface is:
This location is, within the accuracy of these measurements, at the SRB field joint which is immediately above the attach ring 3. The location accuracy is + 4 inches since the pixel size for the image is approximately 4 inches.
The central axis in the X direction of each cylinder (ET, SRB) is used as the reference for the individual Y and Z coordinates. The X reference is the Xt reference for the ET and is the Xrb reference for the SRB. The sense for the coordinates is the same as the right-hand sense for the ET and SRB coordinate systems.
[N86] Table 16 Motion of Right SRBa
|
Report |
Date |
Camera |
Frameb |
MET |
Description |
|
. | |||||
|
EPRCO |
2/22 |
E207 |
- |
73.150 to 73.161 |
The right SRB appears to have pivoted and ruptured the ET. |
|
USAF/WPAFB |
3/17 |
E207 |
578 |
72.636 |
The booster (right SRB) exhibits an angular component of approximately 4 degrees in the Orbiter's + Z direction which probably includes an unmeasured + Y component as well. |
|
JPL |
3/17 |
E207 |
580-599 |
- |
Two different analyses observed no relative motion. |
a Telemetry data confirms right SRB relative motion with respect to the stack at 72.201 seconds MET'.
b Frame numbers were assigned at to facilitate processing. Photographs should be referenced by camera and MET.
Table 17. Postexplosion Right SRB Activity.
|
Report |
Date |
Cameraa |
Frame |
MET |
Description |
|
. | |||||
|
USAF/WPAFB |
3/14 |
E207 |
1715-1767 |
76.414 (1747) |
Very gradual end-to-end movement (pitch). |
|
- |
- |
E206 |
675-829 |
74.200-78.050 |
Roll about the long axis most noticeable from |
|
- |
- |
E207 |
658-793 |
74.650-78.025 |
E207. |
|
USAF/WPAFB |
3/14 |
E207 |
708 |
75.886 |
A rectangular portion of the nose cone and forward end of cylinder ex-hibits a blackened tone along the long side and coincident with the SRB axis150 inches from nose tip, 242 inches x 60 inches in area. |
|
USAF/WPAFB |
3/14 |
E207 |
729 |
76.411 |
Event signals the start of nose tip separations. |
|
- |
- |
E207 |
744 |
76.786 |
Pilot chute first observed. |
|
- |
- |
E207 |
756 |
77.086 |
Drogue chute initially deployed. |
|
- |
- |
E207 |
787 |
77.861 |
Chute reaches full deployment. |
|
USAF/WPAFB |
3/14 |
E207 |
707-716 |
75.861-76.086 |
Edge of plume 1194 inches from tip of nose cone with the center at 1430 inches. Size could not be estimated. |
9. Flashes Downstream of Orbiter Right Wing
Photography of the STS 51-L ascent through 58 seconds was analyzed for anomalous events. Photographs from cameras at loca-tions to the north, south, east, and west of the launch pad were reviewed. Two of these cameras, E217 and E202, recorded flashes downstream of the Orbiter right wing.
Mission elapsed time: 45.217, 48.118, and 48.418 Source: Camera E202 and PLAIDS hidden-line CAD drawing
At 45.217 seconds MET, the E202 camera recorded the first flash downstream of the Orbiter right wing (see figure 140). The E202 camera recorded a second and third flash downstream of the Orbiter right wing at 48.118 seconds MET and at 48.418 seconds MET, respectively (see figures 141 and 142). An addi-tional flash also appears to have been recorded on E202 at 48.384 seconds MET. This flash is not as intense as the previous three and may be a precursor to the one seen at 48.418 seconds MET. In addition to the flashes seen on E202, two flashes were observed on E217 in the corresponding timeframes. The first is observed at 44.2 seconds MET and the second at 47.4 seconds MET. Hidden-line CAD drawings of each of the three flashes accom-pany each picture to show the flash in relation to the vehicle.
This phenomenon has also been observed on other flights dur-ing which no serious anomalies occurred; therefore, these flashes are considered nominal events.
V.E. OTHER OBSERVATIONS.
Several film observations have been deemed noncontributory to the STS 51-L incident by the Photo Team, but will be addressed in this section since many outside observers have requested interpretations. The first of these observations is of two bright spots visible during flight and shown in figure 143. These spots are reflections of the SRB plumes off of the Integrated Electronics Assembly (IEA) box of the SRB and the "stinger" on the OMS pod of the Orbiter. These are typical of previous flights and are simply a result of vehicle geometry.
The next observation is of "further smoke from the RSRB." This is really a series of reported observations at various times during flight and is a result of the usual presence of smoke in the vehicle base region. This typical smoke is due to outgassing and ablation of the ET and SRB insulation materials. From some camera views, it does indeed appear that smoke is in the RSRB aft joint area at a given time; however, this is due to the angle of observation, the smoke is really not coming from the joint. In the top photo of figure 144, the SRB rings are visible through the plume, while in the bottom photo the plume obscures the rings. Careful review of films from various angles by experienced and knowledgeable photo interpreters has led to the determination that no smoke from the joint area is visible after 3.375 seconds.
Another observation was of an "orange finger of flame" which appears on the NASA select video which was broadcast by the networks on the day of launch and appeared to emanate from the SSME's. This phenomenon starts at approximate 60 seconds into flight and is simply contamination of the SSME plumes due to the effluent from the SRB leak which, due to the camera angle gives the appearance of coming from the SSME area.
A. Introduction.
In a contingency situation, the visual information can be an extremely important source of data. This was certainly the case in the STS 51-L incident in which events leading up to the incident were external to the vehicle and open to view; furthermore, the clear, cloudless atmospheric conditions allowed the failure development to be clearly visible from the ground.
In spite of the loss of data from several key camera locations, film data provided early pivotal clues that enabled the investigation to focus on the cause of the accident and later made substantial contributions toward understanding the failure.
It is important to emphasize that the clear-day weather and the resulting imagery collected were very significant in the acci....
....dent analysis investigative work. Had it been a night launch or a launch with a low overcast sky, the amount of time required to reach the conclusions drawn would have been much greater and perhaps never as clearly understood. In the case of STS 51 -L, photographic data were not merely a backup for other instrumentation, they were primary.
B. Findings
The findings listed below are the result of the analysis performed and described in this report.
1. After a thorough review of all photographic and video products available from the flight, the anomalous imagery can be summarized into the following seven major categories:
a. The appearance of smoke at 0.678 second MET in the near vicinity of the RSRB aft field joint located radially approximately 300° to 315° from the + Z axis (clockwise). The last positive visual indication of smoke dispersing below the ET aft dome occurred at 3.375 seconds MET.
b. The appearance of a continuous well-defined anomalous plume on the RSRB in + Z, - Y coordinates at 59.262 seconds MET.
c. A LH2 tank leak occurred near the ET 2058 ring frame at 64.660 seconds MET.
d. The aft end of the RSRB broke away from the ET at approximately 72.201 seconds MET.
e. LH2 tank failure occurred near the 2058 ring frame at 73.124 seconds MET.
f. LO2 tank failure occurred at approximately 73.162 seconds MET.
g. Vehicle structural breakup occurred at approximately 73.327 seconds MET.
2. Closeout photo analyses of the STS 51 -L right SRB aft field joint confirmed that the O-ring did not have any defects prior to mating of the joint in the vicinity of the suspect failure point.
3. No anomalous motions (twang) were observed during the SSME ignition and lift-off time frame.
4. Pad photography confirmed:
a. A problem with the hydrogen vent arm retract latchback mechanism.
b. Liquid oxygen T-0 umbilical carrier plate motions were nominal.
c. Facility ice debris was significant, however, no vehicle anomalies resulted.
d. A dark fluid (H2O) coming from behind an I-beam and kick plate adjacent to the ET gaseous vent line pivot point at the 220 ft. elevation.
5. Postlaunch inspection of the holddown posts revealed that the kickspring assemblies on holddown posts M-3, 4, 7 and 8 were missing. There is no photographic evidence that the kickspring assemblies impacted the vehicle.
6. Eleven photo cameras failed. Primary failure mode is considered to be brittleness as a result of prolonged dry GN2 exposure and extreme temperature. The normal camera failure rate experienced has been 2 to 3 per mission.
C. Lessons Learned
1. Organization.
Immediately after the STS 51-L incident, substantial efforts were begun independently at the three concerned NASA Centers (JSC, KSC and MSFC).
The JSC & MSFC Center Teams worked within the charters of their Center contingency plans. At KSC, the Level II TPS Ice Frost/Debris Team was chartered by the NASA Interim Mishap Investigation Board to be the Photo Analysis & Review Team. Coordination of these activities was limited and communication of results and sharing of image analysis products were a problem because of security constraints, geographical separation of activities, obsolete or inadequate facilities and equipment and the overwhelming magnitude and urgency of the activities. There were some improvements as the situation settled down; however, there was a substantial improvement after the Task Force was formed and the Photo and Video Analysis Team chartered and given responsibility for analysis of imagery.
Internal organization and lack of necessary activities at the Centers created start-up problems and inefficiency which hampered the early efforts. At JSC, there was no image analysis in place at the time of this incident although there were experienced personnel. At MSFC, there was image enhancement activity, but it had not been used in postflight analysis and it was physically and organizationally separated from the group which this work. At KSC the photographic functions were fragmented and scattered throughout the Center.
The key to the progress made in photo analysis from the time the Photographic and TV Support Team was established has been the organizational structure of the team. Common goals and schedules were set, events of interest were selected, roles were assigned, common imagery was defined and common or compatible methods for its analysis established. Analysis products including enhancements were reviewed by the group and interpretation was done as a group which minimized differences in conclusions drawn and allowed a consistent set of interpretations to be established. These results were then accepted by all elements of [N89] the investigation as definitive of the visual events of the incident. The success of this organizational approach indicates that a similar approach should be taken for any future incident. To assure that this is the case, a chartered intercenter Photographic and TV Analysis Team should be included in the NASA contingency plan and subordinate activities At JSC, KSC and MSFC should be made part of the contingency plans at these Centers.
2. Facilities and Equipment
a. Photographic Cameras and Film
Somewhat outdated optical systems for many cameras included only fixed focus lenses. Some imagery was out of focus and lacked detail. This caused small format (16mm) films to be difficult to use for anything other than event timing and gross feature identification; 35mm and 70mm films were markedly superior for precise location of features and for use in enhancements. These cameras are slow (20 to 96 frames per second), whereas 16mm cameras typically run at 400 frames per second and are capable of higher rates. Evaluation of motion picture imagery from mission STS 51-L indicates that precision analysis was inhibited by several factors:
1. Solution/acuity.
2. High noise/granularity.
3. Density clipping of highlights and shadows due to the limited exposure latitude of the camera film.
4. Quality transfer loss on the duplicate prints due to the limited resolution of the print film.
The analysis of imagery from mission STS 51-L, indicates that the latitude limitations of the film prevented the recording of details in the shadow areas including that of the smoke plume as well as a loss of detail in the overexposed highlighted areas such as primary and reflected flame areas. The resolution limitations and higher noise (grain) limited the analysis of detail from high magnification prints.
Several questions were raised during the investigation regarding flame or skin temperatures which could not be answered using the type of film used for launch photography. Black and white film would be more useful where extreme resolution is important, as in determining the location and dimensions of features such as plumes and joint leaks. The camera film breakage rate was responsible for missing the location of a key event, the actual emission of the smoke puffs. Although the location was inferred from images from cameras in other locations, a great deal of extra work was involved in so doing as well as in convincing other investigators of the accuracy of the inferred position. More reliable equipment and better thermal conditioning are in order. Camera positions should be reviewed to ensure overlapping coverage to eliminate blind spots between camera positions.
The need for alphanumeric frame number and GMT as well as an initialization "slate" of film and camera data on all film products was apparent during this investigation. Due to the lack of time displacement markings on some of the films, large efforts were required to establish timing of significant events and wrongly identified frames were, at times, used in scenario development. Digital timing can be placed on film frames. Excellent systems are available to perform this function. If costs of this system are considered to be too high, then all of the cameras should be equipped with a timing index.
b. Television
Television coverage of this incident was useful in developing many of the early conclusions about the failure. Lack of timing on some of the video made it difficult to compare with tracking film data. The video systems should be upgraded to include timing. The state-of-the-art in television is improving with the availability of CCD (charge coupled devices) and HD (high definition) color TV cameras. These cameras eliminate the scan-line
irregularities and image blurring which make it difficult or impossible to locate features precisely with video. The television equipment state-of-the-art should be followed very closely with the goal of updating the OTV system.
c. Support Facilities and Processes
The large volume of photographic and video material generated in the accident investigation placed a severe load on the KSC processing system. Several areas need improvement. The photo analysis equipment, which is obsolete and requires frequent repair and maintenance, is located in crowded and unsuitable facilities. The processes are labor intensive, particularly manpower levels. The photographic support contract is mostly funded by NASA, but is managed by the Air Force. Most of the photo facilities are located on Air Force installations, making access and transport difficult especially during contingency operations. The entire arrangement with the Air Force should be reviewed with the objective of KSC being self sufficient. A review of the Shuttle Processing Contractor role in closeout photos needs to be made. Additionally, KSC needs to have a centralized focused photographic and TV organization and not be fragmented between several organizations.
A controlled archival storage of photographic and video originals, master copies of films, and derived products is required at KSC. This investigation highlighted the need for comparison with previous flight imagery. Material dispersed from KSC to the other Centers needs to be retained and stored at a central location designed for that purpose. No common photographic cataloging and data transfer system exists between Centers, and one should be developed.
There was no capability at KSC for required digitization of film to provide suitable products for digital enhancements. Suitable systems were in place at JSC and MSFC, but high quality products were not made available to these Centers initially. Furthermore, there are no capabilities for secure transmission of digital products between Centers. These problems can be solved readily by upgrading facilities and establishing secure communication networks.
Finally, the systems in place at the three Centers have not been selected for compatibility. Although, it is unnecessary that all Centers have the same equipment or that each of the Centers be able to perform any of the necessary functions, a review needs to be made of the existing capabilities with the goal of enhancing compatibility.
d. Techniques
Prelaunch closeout photographs document the as built configuration of the vehicle. The photos are taken to show overall and closeup views of particular areas, as required. The data provided by these photographs is primarily used by engineering to compare the closeouts to drawing requirements. The closeout photographs are not intended to record data for precise measurements or enhancement as demanded by a contingency situation. However, the quality of closeout photographs could be improved by using experienced photographers rather than hardware inspectors.
This investigation revealed a need for advanced techniques in image analysis and enhancement. Methods for temperature determination, constituent analysis and compensation for atmospheric effects would be useful as well as the use of CAD/CAM systems with computer generated imagery and feature measurements. As an advanced tool, the constituent analysis may have contributed significant data to the smoke composition or liquid hydrogen leak theories.
[N90] D.Conclusions.
1. A contingency plan is required for imagery which calls out an intercenter organization with named chairmanship and membership with a charter parallel to that of the other teams in the NASA contingency plan. Air Force participation would be helpful.
2. At the concerned field centers (JSC, KSC, MSFC) photo contingency teams are required which are parallel to those of the teams currently in Center Contingency Plans.
3. NASA should have a self-sufficiency objective for a total end-to-end photographic and TV products analysis capability. This includes from the initial acquisition of the product through a report writing conclusion capability. Utilization of other Government facilities should be for special project work only. Cost tradeoffs can be performed to help draw the practicality line. This recommendation is intended to be for an agency program capability and is not intended to promote needless redundancy within the STS program.
4. Procedures are required for film review and processing, dissemination of master copies, image analysis and enhancement for use in failure investigation.
5. Common photographic cataloging, communication and data transfer systems between Centers is required.
6. A controlled archival storage system for launch photographic and video original material is required at KSC.
7. A study should be conducted through the intercenter organization and center teams of the future engineering data and analysis required and procedures to be followed for accident prevention purposes and contingency accident investigation at KSC and VAFB. The study should include a review and selection of optics, cameras, film exposures, selective filtering including downrange haze penetration, removal of uncovered blind spots at launch, and coverage for orbit and landing phases.
8. Improve the quality and documentation of closeout photographs by using experienced photographers rather than hardware inspectors with limited photo training experience.
9. Flight hardware paint patterns are required.
10. Include alphanumeric display of frame number and standardized timing on each frame of film and video.
11. A review of the state-of-the art equipment should be made to implement the best capability for engineering analysis purposes.
12. Augment and maintain image analysis and enhancement efforts within the Agency to ensure adequate capabilities.
13. Establish a KSC engineering photographic analysis lab with state-of-art equipment.
14. A capability for making color reversal prints should be established at KSC.
15. There should be an improvement in lighting, especially at night, of critical areas such as the holddown posts on the pad.