Report of the PRESIDENTIAL COMMISSION
on the Space Shuttle Challenger Accident
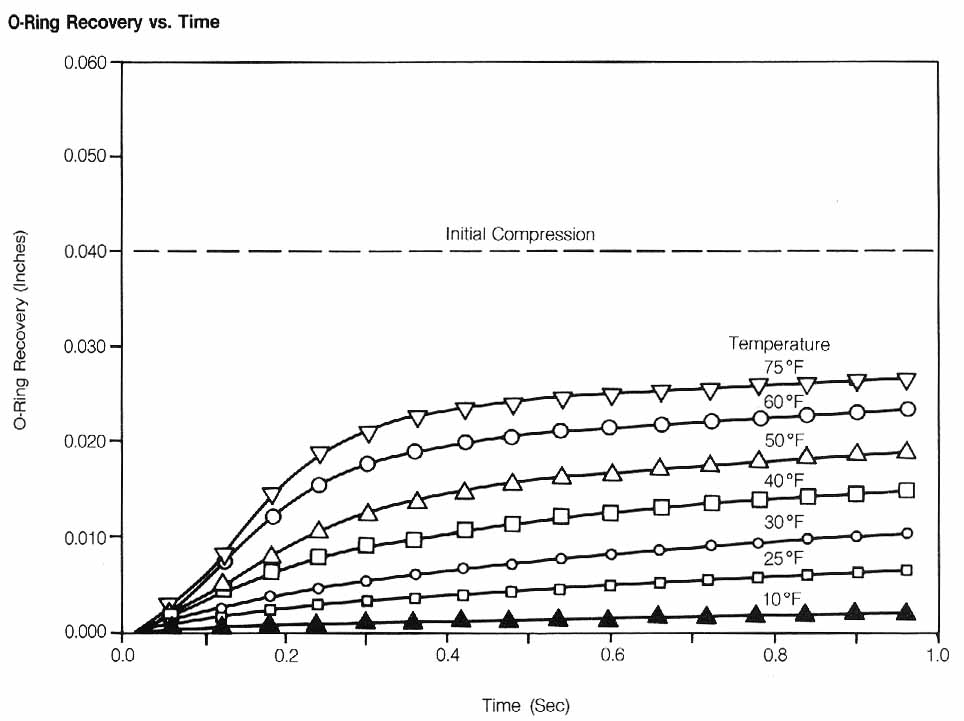 Figure 23. O-Ring Recovery vs. Time. Graph plots O-ring shape recovery in inches against
time in seconds for a variety of temperatures. Note: Average O-ring
Recovery at Various Test Temperatures During First Second After Load
Release. Initial Compression of 40 Mils was Maintained for 2
hours.
- Back -
Figure 23. O-Ring Recovery vs. Time. Graph plots O-ring shape recovery in inches against
time in seconds for a variety of temperatures. Note: Average O-ring
Recovery at Various Test Temperatures During First Second After Load
Release. Initial Compression of 40 Mils was Maintained for 2
hours.
- Back -