|
|
|
|
|
|
|
|
|
|
|
|
|
|
|
|
|
|
|
|
|
|
|
|
| ||
|
|
|
|
| ||
|
|
|
PRO-5317 |
|
|
|
77893901 |
[O155] Radar Data Analysis and Impact Estimation for STS 51-L Debris
1.0 INTRODUCTION
This report summarizes and evaluates radar data collected after the mishap of the Challenger launch vehicle during the STS 51-L launch on 28 January 1986. The primary purposes of the evaluation were to provide impact locations for debris recovery and, when possible, to identify the tracked objects.
All times in this report are expressed in seconds relative to 1638:00 Zulu, unless otherwise specified.
This report does not encompass the evaluations associated with impact locations based upon data of ESMC optical tracking systems or the AN/FPS-66 radar operated by FAA, nor the detailed analyses or radar signal "signature" data. Radar sites are listed in Table 3.
2.0 SUMMARY
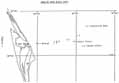
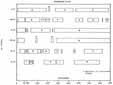
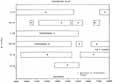
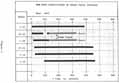
Estimated impact locations for nine objects are listed in Table 1 and mapped in Figure 1. Eleven objects had been tentatively identified from the radar track spans depicted in Figures 2A and 2B, but Objects E end J were found to be redundant to Objects G and F, respectively.
Impact A was of prime importance since it represented debris from the starboard SRB. Objects F and G were parachutes which are believed to have been recovered from the ocean's surface. Objects D and B were believed to be relatively sizeable (2-5 meters) and dense, as gauged by radar boresight recordings and the early impact times of T+207 and T+319 seconds, respectively. Similarly, an impact time of T+ 212 seconds suggested that Object K was a relatively dense object, but its radar cross-section was less than 0.1 square meters.
Objects I and C each had a moderately small final descent rate of about 134 feet/second, with Object C having a very distinctive radar signature with cross-section speculars as large as 158 square meters. Object H was of little interest for recovery operations, since it appeared to be small, light object which may very well have floated upon impact.
In attempting to acquire debris, several aircraft were inadvertently tracked after T+ 1030 seconds, and there were several instances in which radars locked up on spurious signals. These irrelevant track spans are indicated by asterisks in Figures 2A and 2B.
3.0 EVALUATION PROCEDURES
Radar raw metric data, boresight video recordings, event records, and analog recordings become available on January 31. A catalog of tracked objects was begun and, concurrently, priority was given to estimating impact locations for the starboard SRB and other sizeable objects.
In the interest of timeliness, the initial estimate of impact location for each object was based on the final valid radar measurement, which was selected by inspection and then transformed to latitude and longitude. This procedure was more accurate, of course, for objects which had been tracked nearly to splash.
Impact estimates were refined as RAPP processed data became available. Among other outputs, the RAPP computer program provided full density radar data transformed to geodetic latitude, longitude, and height. In utilizing these data, the altitude of each object was extrapolated graphically or numerically to splash to obtain estimated impact time. Latitude and longitude were then extrapolated to impact time to obtain impact position.
Radar boresight video recordings were used to identify visible objects to the extent possible and to estimate physical sizes. Radar cross-section and signature characteristics were evaluated from radar digital recordings and analog Signal/Noise (S/N) recordings.
Identification of radar data spans relative to the tracked object was facilitated by computer plots of the target ground tracks. Radar data were correlated with tracking-camera data by transforming the radar data to the optics sites.
4.0 DISCUSSION
The objects listed in Table 1 are discussed individually in the following paragraphs.
4.1 Object A (Starboard SRB)
Following structural breakup at T+73 seconds, Radar 1.17 shifted track to the starboard SRB without operator assistance. The exhaust plume of the SRB was visible on the radar boresight TV video until approximately T+ 113 seconds. At T+ 88 seconds, and again at T+91 seconds, the aspect of the SRB was such that two distinct plumes were discernible.
After Range Safety destruct at T+ 110 seconds, Radar 1.17 continued track of a large SRB piece until LOS near impact at T+ 286 seconds. Based on signature analysis of the radar S/N recordings, it was estimated that the tracked object was a cylinder/cone combination having an overall length of 5.3 meters. Impact was approximately 39 nautical miles east and 12 nautical miles north of Pad 39B.
In addition to Radar 1.17, the starboard SRB also was tracked by the Ponce de Leon IGOR until T+ 282.9 seconds. A comparison of metric data, carried out by transforming 1.17 data to the IGOR location, confirmed that the two instruments tracked the same object. The IGOR video tape showed that Range Safety destruct action caused at least 3 large fragments, plus smaller pieces, to separate from the tracked object.
Radar/IGOR data for the starboard SRB are summarized in Table 2.
4.2 Object B
Target B was a smoking object which was tracked by Radars 1.17, 1.16, and 0.14, with all three radars being on track at impact at about T+ 391 seconds. Radar 1.16 provided the most extensive coverage, which commenced at T+137 seconds at an altitude of 48 K feet. The physical extent of the object was estimated from radar boresight recordings to be 2 to 3 meters, and the average radar cross-section was 0.5 to 2.0 square meters.
Impact position, which was estimated from Radar 0.14 data, was only about 4,000 feet from the Object D impact.
4.3 Object C
Object C was acquired by Radar 1.17 at an altitude of 25 K feet and was tracked down to an altitude of about 700 feet. Estimated impact time was T+ 543 seconds at a location approximately 26 nautical miles east and 3 nautical miles north of the launch pad.
Object C was not visible on the Radar 1.17 boresight recordings, which appeared to be affected by glare.
The Radar 1.17 S/N recording showed a distinctive pattern with a period of 3.5 to 4.0 seconds, in which radar cross-section spikes as large 158 square meters arose from a baseline level of about 0.4 square meters. The target appeared quite complex, and may have consisted of a flat plate of about 1.5 feet extent with accompanying tubes or struts.
4.4 Object D
Object D was acquired by Radars 19.17 and 0.14 at T+85 and T+107 seconds, respectively, and was tracked to LOS by each radar. It was also tracked briefly by Radar 3.13 from T+128 to T+153 seconds. Impact occurred at T+207 seconds at a location approximately 18 nautical miles east and I nautical mile north of Pad 39B.
The object was visible on the Radar 0.14 boresight TV recording from acquisition to horizon. It left no trail and had a bright white appearance (black and white recording) until about T+175 seconds. The image then showed flashes of both white and black until T+187 seconds, after which time it was consistently black. The physical extent of the object was estimated from the TV recording to be about 5 meters.
Object D was visible on the wider-angle boresight recording of Radar 19.17 only intermittently. At least six plumes or smoke [O156] trails appeared in the field of view up to T+150 seconds, indicating that other objects may have impacted in the vicinity of Object D.
Radar S/N recordings showed Object D to have an average radar cross-section of 1.3 to 3.2 square meters. The radar signature was relatively devoid of distinctive speculars or nulls.
4.5 Object F
Object F was identified from radar boresight recordings to be a parachute of approximately 45 feet diameter. Total height of the parachute and suspended object was estimated to be 95 feet.
Object F was tracked at various times by Radars 1.17, 19.17, and 0.14. Initial acquisition was by Radar 19.17 at T+ 349 seconds at an altitude of 50.2 K feet. Average radar cross-section was 2.0 to 10.0 square meters.
Impact location was estimated using data from Radars 1.17 and 0.14, which were tracking near the impact time of T+888 seconds. Impact was approximately 31 nautical miles east and 1 nautical mile north of Pad 39B. Final descent rate of the parachutes was 70 feet/seconds.
4.6 Object C
Target G was tracked at various times by all five mainland radars and Radar 3.13. It was identified from radar boresight video to be a chute or chutes having a diameter of about 110 feet. The suspended object or objects had a physical extent of about 40 feet and appeared to include a smaller, or partially opened, chute. The total height of the chute and suspended objects was about 210 feet. Average radar cross-section was 3 to 10 square meters.
The most extensive coverage of Object G was by Radar 1.16, which acquired an altitude of 66.5 K feet and had continuous track to near impact at T+1487 seconds. The impact location, approximately 37 nautical miles east and I nautical mile south of Pad 39B, was estimated from the Radar 1.6 track data. Final descent rate of the chute was about 37 feet/second.
4.7 Object H
Object H was a slow falling target which was tracked by Radars 0.14 and 19.14, and briefly by Radar 19.17. First acquisition was by Radar 0.14 at an altitude of 24 K feet, and final coverage was by Radar 19.14 at an altitude of 4 K feet.
Because the object fell at a rate of only 20 feet/second, it was necessary to extrapolate Radar 19.14 data ahead 223 seconds to splash, which diluted the accuracy of the estimated impact location. The slow descent rate suggested a low density object which might have floated upon impact. Approximate impact time was T+2583 seconds at a point 56 nautical miles east and 7 nautical miles south of Pad 39B.
The radar cross-section of Object H was .02 to .13 square meter.
4.8 Object I
Based upon Radar 3.13 data for T+388 to T+457 seconds, the Object I impact was estimated to be approximately 34 nautical miles east and 5 nautical miles north of the launch pad. The uncertainty of the Table 1 impact estimated was judged to be I minute, since the radar data were extrapolated for the rather large time of 277 seconds from an altitude of 37 K feet.
Radar cross-section was .02 to 50 square meters, and final descent rate was 134 feet/second.
4.9 Object K
Radar 19.14 tracked target K from T+185 to T+200 seconds, but the data appeared reasonable only for the time space of T+190 to T+197 seconds. Radar elevation angle data were essentially static prior to T+ 190 seconds and were erratic after T+197 seconds. There was some doubt that any of the data represented valid track since radar S/N remained rather constant at 38 to 45 dB, even when the radar pedestal was apparently pointed several beamwidths off the target. There was a distinct possibility that the returned energy was from a cloud, smoke column, or distributed reflectors, rather than a single discrete target. However, there also remained the possibility that a discrete object was discriminated from the background signal level and was tracked for seven seconds.
During the time span of T+190 to T+197 seconds, the apparent target descended from 18.3 K feet to 12.5 K feet altitude, giving a projected impact time of 212 seconds at a point only 1 K feet from the estimated Object D impact. This seemed reasonable, since it appeared from Radar 19.17 boresight recordings that several objects had been falling near Object D.
The indicated radar cross-section during the entire track was .003 to .06 square meter.
[O157]TABLE 1. IMPACT ESTIMATES FROM RADAR DATA.
|
Obj |
| |||||
|
. | ||||||
|
ID |
T+Sec |
N. Lat |
W. Long |
CFP* |
Radar |
Comments |
|
. | ||||||
|
A |
286 |
28°49'10" |
79°52'29" |
2.5" |
1.17 |
Starboard SRB |
|
B |
319 |
28°38'23" |
80°16'58" |
1.0" |
0.14 |
Smoking Object |
|
C |
543 |
28°40'12" |
80°07'28" |
1.0" |
1.17 |
Not Visible |
|
D |
207 |
28°39'01" |
80°16'44" |
1.0" |
19.17 |
5-meter Size |
|
F |
888 |
28°38'54" |
80°02'11" |
2.0" |
0.14 |
Small Chute |
|
G |
1487 |
28°36'01" |
79°55'00" |
1.0" |
1.16 |
Large Chute |
|
H |
2583 |
28°30'16" |
79°33'35" |
50.0" |
19.14 |
Not Visible |
|
I |
730 |
28°42'59" |
79°59'08" |
60.0" |
3.13 |
Not Visible |
|
K |
212 |
28°38'58" |
80°16'33" |
4.0" |
19.14 |
Not Visible |
[O158] TABLE 2. STARBOARD SOLID ROCKET BOOSTER DATA SUMMARY FOR OBJECT "A".
Radar 1.17 Data at Significant Times
|
T+Sec |
Event |
Height (K ft) |
|
. | ||
|
73.2 |
Mishap |
50.8 |
|
110.3 |
Destruct |
101.3 |
|
113.0 |
Break-up |
104.0 |
|
146.3 |
Apogee |
122.4 |
|
286.0 |
Impact |
0.0 |
Radar 1.17 Signature Data
|
Cylindrical Portion Peak: |
27.6 dBsm (575 m2) |
|
Conical Portion Peak: |
28.9 dBsm t776 m2) |
|
Cylindrical Portion Length: |
2.4 meters |
|
Conical Portion Length: |
2.9 meters |
Ponce de Leon Mobile IGOR
Tracked same object as Radar 1.17 to T+282.9 seconds; displayed 3 additional pieces separating after T+113 seconds.
[O159] TABLE 3. GEODETIC COORDINATES FOR ESMC C-BAND RADARS.
|
. |
| |||
|
. | ||||
|
|
|
|
|
|
|
. | ||||
|
19.17 |
KSC |
|
|
|
|
1.17 |
CCAFS |
|
|
|
|
1.16 |
CCAFS |
|
|
|
|
19.14 |
KSC |
|
|
|
|
0.14 |
PAFB |
|
|
|
|
3.13 |
GBI |
|
|
|
NOTE: Survey values refer to the center of rotation of the antenna
[O164] Glossary
|
AOS |
Acquisition of Signal |
|
ARTC |
Air Route Traffic Control |
|
BET |
Best Estimate of Trajectory |
|
CCAFS |
Cape Canaveral Air Force Station |
|
dBsm |
DeciBels relative to one square meter |
|
DPDE |
Data Playback and Digitizing Equipment (Video) |
|
ESMC |
Eastern Space and Missile Center |
|
ET |
External Tank |
|
ETR |
Eastern Test Range |
|
FAA |
Federal Aviation Administration |
|
IFLOT |
Intermediate Focal Length Optical Tracker |
|
IGOR |
Intercept Ground Optical Recorder |
|
KSC |
Kennedy Space Center |
|
LOS |
Loss of Signal |
|
LOV |
Loss of Visibility |
|
MCBR |
Mobile C-Band Radar |
|
MSFC |
Marshall Space Flight Center |
|
MIGOR |
Mobile Intercept Ground Optical Recorder |
|
NITE |
N-Interval Trajectory Estimation Program |
|
PDV |
Peak Detected Video |
|
PRF |
Pulse Recurrence Frequency |
|
RAE |
Range/Azimuth/Elevation |
|
RAPP |
Computer Program 331, Radar Position Program |
|
RCS |
Radar Cross Section |
|
ROTI |
Recording Optical Tracking Instrument |
|
RTI |
Range/Time/Intensity (Video) |
|
S/N |
Signal-To-Noise Ratio |
|
SRB |
Solid Rocket Booster |
|
TCAR |
Computer Program 017, Tracking Camera Automatic Reduction |
|
UCS |
Universal Camera Site |
|
WGS |
World Geodetic System (ETR uses WGS-72) |
|
WSMC |
Western Space and Missile Center |