[L190] The investigation of the STS 51-L incident by the SRM Working Group involved numerous tests at both MSFC and at the Morton Thiokol, Wasatch Division.
A detailed description of each test is a part of the SRM Working Group files. The following is a listing of the tests performed followed by a brief description of each test, the test objectives, and results.
|
|
|
|
|
|
|
. | |
|
Characterization of SRM joint Seal Materials | |
|
O-Ring Defect Analysis | |
|
Burn (Smoke) Tests | |
|
[3 and 7] |
[O-Ring Resiliency Investigation]* |
|
Dial Indicator Rebound Resiliency Test | |
|
O-ring Resiliency Investigation | |
|
Short Term Resiliency Testing of O-rings | |
|
Long Term Resiliency Testing of O-rings | |
|
Dial Indicator Rebound Resiliency Test of Defect O-rings | |
|
Conoco Grease Blowthrough Test | |
|
Randolph Putty Blowthrough Test | |
|
Sealing vs. Temperature Transparent Putty Behavior | |
|
Sealing vs. Temperature of O-ring Static Fixture | |
|
Sealing vs. Temperature; O-ring Discrete Increment No. (Piston-cone) Fixture, Part I and Part II | |
|
Randolph Putty Blowthrough Evaluation Test | |
|
Scenario 4B. Ice Effects on Joint Seal | |
|
O-ring Resiliency Investigation Composition Variations** | |
|
SRM O-ring Stacking Damage Test | |
|
Ground Truth Photo Test | |
|
|
|
|
|
|
|
. | |
|
Leak Check Port Plug | |
|
SRB Referee Test | |
|
Full Scale Joint Cross Section Test Firings | |
|
Five-inch Motor Tests | |
|
Dynamic Vacuum Putty Extrusion Tests | |
|
O-ring Viscoelastic Properties Tests | |
|
O-ring Static Blowby Test | |
|
O-ring Dynamic Blowby Test | |
|
O-ring Resiliency Test | |
|
SRM Frozen Field joint Test | |
|
Hot O-ring Extrusion Test | |
|
Cold O-ring Extrusion Test | |
|
Ice in joint Tests | |
|
O-ring Twist Test/Demonstration | |
|
Seal Contamination Tests | |
|
O-ring Assembly Damage Test | |
|
Test No. 1A |
Test Report Date: 3/31/86 |
Title: Characterization of SRM Joint Seal Materials
Objective:
Develop detailed thermal and mechanical characterization data primarily for the fluorocarbon O-ring seal material, as well as selected characterization data for other materials in the joint and adjacent to the joint.
Test Description:
Test Limitations.
Limited to basic material characterization data-cannot simulate joint seal test configurations.
Test Variables:
Results/Conclusions:
The thermal analyses generally indicate an onset of decomposition of the O-ring material at 465°C to 470°C (870°F to 880°F), with decomposition of the other joint materials at progressively lower temperatures. Glass transition of the O-ring material has measured to be -11°C to -18°C by two methods, and the CTE was 98 x 10-6 in/in F to 116 x 10-6 in/in F measured at 75°. The thermal data further indicated relatively little variability based on the different O-rings and batches sampled.
Mechanical test data demonstrated a progressive increase in parameters such as tensile and relaxation modulus, as well as hardness with decreasing temperature. This trend was observed with dynamic as well as static modulus measurements. The mechanical properties (like the thermal properties discussed earlier) did not appear to vary significantly with different O-ring/batches. This is substantiated by the batch data comparisons run at the O-ring vendor plant. It would appear that the vendor presumption of equivalence of starting material and raw material compositions is reasonably valid.
The scarfjoints in the flight O-rings appear to fail at a somewhat lower stress (15 - 20 %) than the parent material, based on the five samples tested. The high heat rate testing of the joint areas indicated generally comparable performance to the parent material.
|
Test No. 1B |
Test Report Date: 3/25/86 |
Title: O-ring Defect Analysis
Objective:
Define the type and severity of defects in flight-type case joint O-rings and assess any effect they may have on physical, thermal and mechanical properties of the O-ring.
[L191] Test Description:
Analysis/test activities specified below were performed.
Test Limitations:
No correlation of defects with flight O-rings in STS 51-L hardware.
Test Variables:
Type and magnitude of defects
Results/Conclusions:
Based on the analysis and testing performed on flight case joint O-ring SN0001782, the observed high density, low density, and surface defects do not appear to significantly alter the physical and mechanical characteristics of the O-ring material. The effects of typical defects on the temperature response (resilience) characteristics of the material are to be reported under MSFC Test 3E. The tensile strength testing on surface scratch areas is inconclusive without additional appropriate test samples.
|
Test No. 2 |
Test Report Date: 3/30/86 |
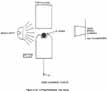
Title: Test Burn (Smoke) Tests
Objective:
To observe burning characteristics of joint seal materials and obtain information on the potential origin of "black puffs" early in flight.
Test Descriptions:
Test Limitations:
Test Variables:
Results/Conclusions:
The results of the tests are summarized in Table C.1. Some of the joint seal materials (i.e., vulcanized NBR, liner and inhibitor) upon decomposition in an inert atmosphere produced only white or light gray smoke, but upon introduction into an air environment produced large quantities of black smoke.
|
Tests No. 3 and 7 |
|
Title: O-Ring Resiliency Investigation
Introduction:
MSFC Test 3 and MSFC Test 7 were conducted to determine the influence of several factors, and their interactions on the resiliency of SRM O-ring materials. MSFC Test 7 focused specifically on compositional and batch-to-batch variations on O-ring resiliency. Five "subtests" were focused on different issues of the overall resiliency study, and these related investigations were reported individually under MSFC Test 3. The summaries of all tests have been attached to clarify the objectives, test fixtures, limitations, variables, and conclusions specific to each. However, the general objective and approach for Tests 3 and 7 may be summarized as presented below. The key conclusions from the tests are also presented in summary manner.
Objective:
The objective of the MSFC Resiliency Investigation was to determine the effects of temperature, compression, compression duration, compositions and their interactions, and the effect of various defects on this resiliency, or recovery capability of SRM O-ring materials.
Approach:
The approach followed in all experiments may be generalized as follows:
1. An O-ring sample (0.280-inch nominal cross sectional diameter) is contained in a groove of flight specification dimensions.
2. The O-ring sample is compressed.
3. The O-ring and test fixture are cooled to test temperature.
4. Compression is maintained for a specific period of time after the time of initial compression.
5. The load is removed rapidly and the O-ring recovery is monitored.
Conclusion:
1. Initial comparisons of the data generated by MSFC Tests 3A, 3B, 3C, and 3D indicate good agreement among the methods. These data correlate well with those generated by the Aerospace Corp. Further, segment tests conducted under MSFC Test 3B validate the more rapid initial recovery observed in MSFC Test 3C and correlate well with Test 3B circular ring results.
2. A reduction in the O-ring recovery rate is produced after a compression duration of 4 hours or longer.
3. Temperature is the dominant factor in controlling initial O-ring recovery capability. The rapid springback evident in the 66-mil response at 75°F is effectively eliminated at 25°F. The effect of the 72-hour compression duration evident at 73°F is absent at 25°F.
4. Recovery may be accurately modeled as being linear with increasing temperature in the range of 25°F to 73°F. Further, over the first critical second, the slope remains constant for the 40-mil and 66-mil initial compressions.
5. Recovery is linear with increasing compression during the first critical second, and the slopes remain constant during this period.
6. No significant differences were observed in the recovery characteristics of the samples, from the three different batches in tests at 75°F and 25°F.
7. The springback mechanism is unchanged by adding small inclusions to the baseline O-ring material or by adding a scarf joint.
|
Test No. 3A |
Test Report Date: 3/26/86 |
Title: Dial Indicator Rebound Resiliency Test
Objectives:
To determine the resiliency and compression set of the SRM field joint O-ring material at 22°F, 30°F, and 75°F.
Test Description:
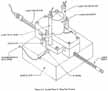
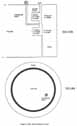
The O-ring rebound is measured and recorded using an LVDT and a multipen strip chart recorder. A 1/2-inch-long 0.282-diameter O-ring was placed in an REM configuration.....
[L193] .....O-ring groove as the test specimen. A drawing of the test fixture is shown in Figure C.1.
Test Limitations:
The test specimen is a straight, ½-inch-long segment of O-ring stock.
End effects may influence the response.
Test Variables:
Results/Conclusions:
Test results show that at room temperature an O-ring which has been compressed approximately 0.036 inch when released will spring back approximately 0.020 inch in 0.6 second.
At cold temperatures, springback of the O-ring is reduced. Data indicate that O-ring springback at 30°F is approximately 0.010 inch in 0.6 second and that 22°F, springback is 0.002 to 0.003 inch at 0.6 second.
|
Test No. 3B |
Test Report Date: 4/2/86 |
Title: O-Ring Resiliency Investigation
Objective:
The objective of MSFC Test 3B was to determine the effects of temperature, compression, compression duration, and interactions of these factors on the resiliency, or recovery capability, of O-ring materials used in the SRM field joints.
Test Description:
A subscale O-ring (0.280-inch nominal cross sectional diameter) is contained within a circular groove machined to field joint specifications and compressed to a specific squeeze. Compression is maintained at the test temperature for a defined period. The compression plate is then withdrawn rapidly, and the O-ring recovery is monitored with an extensometer.
Test Limitations:
The O-rings are tested in a face-seal mode rather than the radial-seal mode of the actual SRM field joint.
The O-rings are compressed from an initial stress-free state; i.e., no stretch or hoop strain is applied.
Test Variables:
Temperature: 10°F, 25°F, 30°F, 40°F, 50°F, 60°F, 75°F
|
Compression: |
|
|
|
|
|
. |
|
|
|
|
Results/Conclusions:
|
Test No. 3C |
Test Report Date: 3/25/86 |
Title: Short Term Resiliency Testing of O-Rings
Objective:
The purpose of these tests was to determine the effects of temperature and compression on O-ring resiliency for short term compression durations. Samples from batch 268535 (25B ft, secondary composition) and batch 267768 were tested and compared.
Test Description:
Uses straight section of O-ring; compression applied over a 4-inch length. See attached Figure C.3. Uses light transmitted between opening of O-ring edge and top of platen to measure/evaluate both initial opening time and relative degree of separation.
Test Limitations:
The test specimen is a straight, 4-inch segment of O-ring stock.
The segment is compressed from an initial stress-free state; i.e., no stretch is applied.
Test Variable:
Results/Conclusions:
Short Term Compression Duration (approximately 5 to 10 minutes)
Long Term Compression Duration (30 minutes)
|
Test No. 3D |
Test Report Date: 4/1/86 |
|
|
(Interim) |
Title: Long Term Resiliency Testing of O-Rings
Objective:
The purpose of these tests was to determine the effects of temperature and compression on secondary O-ring resiliency for long term compression of 30 minutes to 30 days. Due to the long term duration, this report contains the testing accomplished to April 1 and is an interim report that will be updated when the series is completed.
Test Description:
O-ring segment (4 inches in length) contained within field joint dimensions groove is compressed to a specific squeeze. Compression is maintained for extended period of time (30 days). Load is released and O-ring recovery is monitored mechanically and optically.
Test Limitation:
Test specimen is a small, straight segment of O-ring stock. Load release is not at programmed rate.
[L196] Test Variables:
Results/Conclusions:
At 75°F, a trend of slower recovery rates was evident for compression durations of 4 hours and longer when compared to the recovery rates after only 30 minutes or 1 hour duration.
At 25°F, the length of compression time (up to 72 hours) does not affect the recovery rate during the critical first second after load release.
As the compression duration was increased beyond 30 minutes, the material required a longer time to regain 90% of compression and this behavior was more pronounced at 25°F than 75°F. Table C.2 and Table C.3 show the percent of compression regained after release of the top plate.
|
Compression Duration |
% Compression Regained at Various Times from Release |
Time to Regain 90% | ||
|
. | ||||
|
. |
|
|
|
. |
|
30 min |
|
|
|
|
|
1 hr |
|
|
|
|
|
12 hr |
|
|
|
|
|
24 hr |
|
|
|
|
|
72 hr |
|
|
|
|
|
Compression Duration |
|
Time to Regain 90% | ||
|
. | ||||
|
0.2 sec |
|
|
. | |
|
30 min |
|
|
|
|
|
1 hr |
|
|
|
|
|
12 hr |
|
|
|
|
|
24 hr |
|
|
|
|
|
72 hr |
|
|
|
|
|
Test No. 3E |
Test Report Date: 4/2/86 |
|
|
(Interim) |
Title: Dial Indicator Rebound Resiliency Test of Defect O-Rings
Objective:
To determine the resiliency and compression set of various defect SRM field joint O-ring materials at 22°F and room temperature.
Test Description:
Utilize resilience tester developed for MSFC Test 3A (Figure C.4) to test O-ring resilience in selected defect locations from flight case joint O-rings.
Test Limitations:
Not dynamic test fixture. Does not include effects of O-ring pressure actuation.
Test Variables:
Results/Conclusions:
The data contained in this report are very similar to results presented in the final report for MSFC Test 3A. It is evident in the data that the springback mechanism is unchanged by adding inclusions to O-rings or by adding a scarf joint.
The variances in data for O-rings with inclusions is small and is within bounds of data obtained for baseline O-rings. It is important to note that there is a large difference between the springback rates at the two temperatures.
|
Test No. 7 |
Test Report Date: 4/2/86 |
Title: O-Ring Resiliency Investigation-Composition Variations
Objective:
The objective of MSFC Test 7 was to determine the effects of different compositions and batch-to-batch variations of the same composition on the resiliency of SRM O-ring materials.
Test Description:
A subscale O-ring (0. 280-inch nominal cross sectional diameter) is contained within a circular groove of flight specification dimensions and compressed to a specific squeeze in an Instron load frame. Compression is maintained at test temperature for a defined period. The compression plate is withdrawn rapidly, and the O-ring recovery is monitored with an extensometer.
Test Limitations:
Test Variables:
Results/Conclusions:
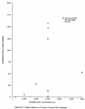
Seven tests were conducted on O-rings manufactured from each of the three batches at 75°F and 25°F with an initial compression of 40 mils. The compression duration for all tests was 2 hours. Results of the individual tests grouped by test conditions are presented in Appendix C of the Test Report. The averages of these tests with scatter bars, one standard deviation in width, are presented for each test condition in Figures 30-32 of the Test Report.
It is apparent from examination that the populations at each condition and over each time interval are in very close agreement. Results for the three batches at 25°F are presented in Figures C.5, C.6, C.7. Upon close comparison, the following qualitative evaluation may be made:
1. At 75°F over the first 1 second, the recovery of batch 267768 material (hereafter as P) greater but within one standard deviation of batch 268535 (hereafter S). S is approximately the same amount greater than the response of batch 273043 (hereafter H).
2. At 75°F over the first 12 seconds, P equals S and H is again low, but within 1 sigma.
3. At 250°F over the first 1 second, P equals H and S is slightly low, within 1 sigma.
4. At 250°F over the first 12 seconds, S equals H and P is more than one standard deviation above these.
For an accurate assessment of the equivalence of these populations, a statistical analysis must be performed. At present, a test analysis for comparisons of the means is underway.
|
Test No. 4A |
Test Report Date: 3/15/86 |
Title: Conoco Grease Blowthrough Test
Objective:
Determine the cold gas pressure at which rupture or blowthrough occurs in the Conoco HD-2 grease as a function of......

[L199]....thickness and temperature. This test was to define the basic correlations of grease pressurization with thickness and temperature for a given sample cross section.
Test Description:
Test proceeds by forming layer of grease on ledge of bottom of test fixture. Next the fixture is assembled and a pressure sufficient to rupture or blow through the grease in less than 5 seconds is "dumped" on the inner face of the sample (Figure C.8).
Test Limitations:
Flight hardware grease application geometry and joint rotation cannot be emulated for grease samples in this fixture.
Test Variables:
Results/Conclusion:
The Conoco grease appears to have sufficiently low viscosity not to be significantly affected by temperature and layup thickness in the comparative pressurization tests. This observation is drawn only for the temperature and thickness ranges used in the test. Based on the relative ease of blowthrough at very low test pressure, the grease would not be expected to significantly affect the case joint pressurization. No further testing is recommended in this test configuration.
|
Temperature Degrees F |
Blowthrough Pressure, psi |
Thickness Inches |
Time sec |
|
. | |||
|
|
|
|
|
|
|
|
|
|
|
|
|
|
|
|
|
|
|
|
|
Test No. 4B |
Test Report Date: 3/15/86 |
Title: Randolph Putty Blowthrough Test
Objective:
Determine the cold gas pressure at which rupture or blowthrough occurs in the Randolph putty as a function of thickness, temperature and moisture. This test series was to determine the basic response of putty to pressurization as a function of temperature and moisture for a controlled sample cross section.
Test Description:
Flat plate test fixture with milled out section was used for testing (Figure C.9). Putty was installed to correct thickness using shims. Fixture was assembled and pressurized at test temperature.
Test Limitations:
Flight hardware putty layup pattern and joint rotation cannot be simulated. This is a comparative type of test only to define putty blow through characteristics.
Test Variables:
Results/Conclusions:
The temperature/thickness effects on blowthrough pressure are summarized in Table C.4:
|
. |
| ||
|
Test Temperature Degrees F |
|
|
|
|
. | |||
|
20 |
|
|
|
|
40 |
|
|
|
|
60 |
|
|
|
A number of successive runs had to be performed to determine the blowthrough pressure listed in Table C.4. Typically, a lower pressure was utilized initially and held for 2 minutes or until blowthrough occurred. If the putty held that pressure, it was increased and held an additional 2 minutes to determine the threshold pressure.
The results of the moisture conditioned pressure tests are summarized in Table C.5.
|
Test Temperature Degrees F |
| ||
|
. | |||
|
. |
% RH* |
50% RH |
100% RH |
|
20 |
1000 psi/150 sec |
500 psi/ 0 sec |
50 psi/99 sec |
|
60 |
1000 psi/ 2 sec |
175 psi/11.5 sec |
30 psi/80 sec |
*RH = Relative humidity
The 0% conditioned putty held 1000 psi test pressure at 20°F for the 2-minute period and no failure time was established. It should be noted that the putty under these conditions was extremely stiff and dry, and did not represent a reasonable flight hardware application condition. It was included in the matrix to bracket the entire range of pressure response.
The test results confirmed the expected response of the Randolph putty. In general, blowthrough pressure increases with decreasing temperature, and decreases with increasing putty test thickness. Additionally, increasing amounts of moisture in the putty decreases the blowthrough pressure significantly at both test temperatures. This would be expected from the observed reduction in viscosity of the putty with increasing moisture content.
|
Test No. 4D |
Test Report Date: 4/13/86 |
Title: Sealing vs. Temperature Transparent Putty Behavior
Objective:
Observe possible putty movement and other physical parameters using a transparent test fixture.
Test Description:
Observe putty movement, blowthrough or other motion that occurs during leak check and pressurization. Fixture is designed to allow video tape of putty and O-ring movement when pressurized (Figure C.10).
Test Limitations:
Complete visualization of test fixture not possible at high pressure (700-1000 psi) due to limitations on plastic parts.
Test Variables:
Results/Conclusions:
Three runs were performed on the transparent putty fixture at each of the two gap openings, 0.020 and 0.080 inch, using KSC conditioned putty (12 hours/80% relative humidity/80-85°F). The putty movement on pressurization was monitored by video, and in each case, putty uniformly extruded to the primary O-ring. The video tape data indicate within test fixture that the putty does begin to hold pressure off the primary O-ring during the 1-second time frame. This is consistent with MTI results on their putty fixture. Also, the 0.020-inch putty gap repeatedly held pressure off longer than the 0.080-inch gap.
|
Test No. 4E |
Test Report Date: 3/14/86 |
Title: Sealing vs. Temperature of O-Ring Static Fixture
Objective:
The purpose of this test series was to determine temperature effects on the ability of SRM flight-type O-rings to effectively seal when pressurized.
[L202] Test Description:
See Figure C.11. O-rings and fixture are chilled down to specified temperature. O-rings are in a static condition when 1000 psig pressurization pulse, with a 10,000 psi/second ramp rate, is applied.
Test Limitations:
Test Variables:
Results/Conclusions:
Based on analysis of accumulated test data it was shown that SRM flight-type O-rings tested under static condition will effectively seal at selected temperatures from ambient down to 10°F provided a positive squeeze is maintained. This conclusion is supported by the Data Plots, Static Fixture Test Matrix and Test Results Summary in the Test Report.
|
Test No. 4H |
Test Report Date: 4/15/86 |
Title: Sealing vs. Temperature; O-Ring Discrete Increment No. 1 (Piston-Cone) Fixture, Part I and Part II
Objective
The purpose of this test series was to determine capability of uniformly loaded flight-type O-rings to seal when gap is varied in relationship to pressure, temperature and time.
Test Description:
In Part I, initial O-ring gap is set to specified amount. Fixture is then cooled to specified temperature. O-ring gap can be changed to a new setting just prior to pressurization. (See Figure C.12.) This test configuration simulates a delay in pressurization of the O-ring.
In Part II, dynamic testing was performed by opening the O-ring gap per specified gap opening curves. Maximum and minimum squeeze conditions were investigated. This test configuration simulates pressurization of the O-ring without a delay.
Test Limitations:
Test Variables:
Results/Conclusions:
Part I
Based on analysis of the accumulated test data, it was shown that at 25°F, at both maximum and minimum squeeze conditions tested leakage past the O-rings will occur at 0.250 second and 0.500 second into the SRM start transient when simulating a delayed pressure actuation of the O-rings. At the maximum squeeze conditions tested (0.004-inch gap), sealing is effective from ambient temperature down to 53°F, but becomes marginal at 50°F with a pressure delay of 0.500 second. Tests run at 70°F, with both minimum and maximum squeeze conditions, show no leakage past the O-rings.
Part II
Under dynamic testing conditions it was shown that with a maximum initial gap (0.020-inch), rounding, and pressure actuation, both primary and secondary O-rings demonstrated the capability to seal from ambient to 25°F. With a 0.010-inch initial gap, no rounding, and pressure actuation, the primary O-ring sealed with slight blow-by at 25°F. With a minimum initial gap (0.004-inch), no rounding, and pressure actuation, both primary and secondary O-rings demonstrated the capability to seal at temperatures from ambient down to 55°F.
|
Test No.: 4J |
Test Report Date: 3/28/86 |
Title: Randolph Putty Blowthrough Evaluation Test
Objective:
Investigate the putty blowthrough characteristics across a gap with a putty buildup on the pressure side. This test series was to determine the basic response of putty, to pressurization as a function of temperature and thickness.
Test Description:
See Figure C.13.
Test Limitations:
Test Variables:
Results/Conclusions:
In general, blowthrough pressure increases with decreasing temperature and decreases with increasing putty test thickness, and blowthrough occurs faster at 940 psi than at 760 psi.
The test results also show that the Randolph putty does exhibit some self-sealing capability demonstrated by audible "popping" and a stabilization or increase in pressure within the test fixture. The self-sealing capability is usually of short duration with a "pop" quickly followed by more "pops." This self-sealing capability existed at the 0.010-inch thickness at both 25°F and 60°F. At the 0.070-inch thickness the self-sealing capability existed at the 25°F, and to a much less extent it was evident at the 0.070-inch thickness at 60°F and the 0.200-inch thickness at 25°F.
The test results also show that with continuous pressurization a blowthrough may occur in the putty, and the self-sealing property of the putty will allow the Putty to reseal and the pressure to increase. This increased pressure was not shown when the pressure was cut off immediately after reaching the desired value ("closed" system) because there was no continuous flow possible.
Based on these observations, and the temperatures and thicknesses tested, it is reasonable to expect the putty to hold several hundred to 1000 pounds of pressure for several seconds; however, these results cannot be used to quantify this effect.
|
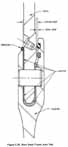
Test No. 5 |
Test Report Date: 3/29/86 |
Title: Scenario 4B. Ice Effects on joint Seal
Objective:
The objective of this series of testing is to assess the effect of ice formation in the gap between the tank and inner leg of the clevis on the secondary O-ring.
Test Description:
Figure C.14 is a sketch of the ice effects test fixture. Ice formation and O-ring movement if any, is recorded by video tape through plexiglass from the front side of the O-ring grooves. Gap between clevis and tang is filled with water up to just beneath secondary O-ring. Fixture is than cooled below freezing, and ice formation and O-ring movement are video taped.
Test Limitations:
Although the cross sectional volume of the annular space beneath the secondary O-ring in the fixture is very close to that in the SRM joint, the gap beneath the O-ring is much narrower
[L206] ....over a longer distance than in the joint, thus slightly enhancing the effect of water/ice.
Test Variables:
Results/Conclusions:
Based on the test results, water does not have to be in contact with the secondary O-ring prior to freezing in order to unseat the O-ring. In fact, significant hydraulic pressures greater than leak check pressures that unseat the O-ring may be generated upon freezing, and these pressures and/or mechanical blockage can prevent the O-ring from reseating until the ice has melted.
|
Test No. 8 |
Test Report Date: 3/31/86 |
Title: SRM O-Ring Stacking Damage Test
Objective:
Assess the potential for damaging the field joint O-rings during SRM stacking by simulating tang and clevis interference using a section of a flight joint.
Test Description:
A section of a flight aft center segment tang and its associated aft segment clevis are secured in rigid fixtures in a tensile test machine (Figure C.15). The clearances and interferences of mating surfaces are controlled for each test. The tang and clevis sections are mated and any effects on O-rings and metal surfaces are recorded.
Test Limitations:
May not be able to detect significant changes in O-ring temperature during test (if they occur).
Test Variables:
Results/Conclusions:
In summary, initial O-ring tension (or lack of) significantly affects the probability of elongation and rolling of the O-rings during assembly. Elongation increases probability of damaging O-rings due to bulging, and roll may help drag debris across sealing surfaces and into grooves. Rolling of primary O-ring at ignition may move debris into a position between O-ring and sealing surface, promoting a leak path.
A test run without grease (No. 15) resulted in significant 0-ring damage (3/16 x 5/12 inch bite) and emphasizes the importance of liberal lubrication at assembly.
Mating metal surface interference and tang angle do not appear to affect ability of O-rings to seat without damage; however, increased interference increases the probability of generating metal debris as a result of tang or clevis damage.
|
Test No. 9 |
Test Report Date: 3/31/86 |
Title: Ground Truth Photo Test
Objective:
The objective of this investigation was to determine if the closeout photographs showed evidence of a damaged or defective O-ring or the presence of contamination in the joint or on the O-rings.
Test Description:
A 3-foot-long curved section of the inner clevis has been fabricated on nominal dimensions. Photographs of O-rings installed in this fixture are to be taken using the identical camera, lens, perspective, etc., as the closeout photos. O-rings with known artifacts will be used. A matrix of bare, greased O-rings, bare and greased grooves, scarf joints at various orientations, etc., will be photographed.
Test Limitations:
The closeout photographs document the full periphery of the clevis and O-rings, but the photography was lacking in quality such that only 1 to 1.5 feet of clevis and O-ring could he analyzed, primarily because of lack of focus. Eleven slightly overlapping photographs were taken, allowing about 11 to 17 feet of the total joint periphery to be photographically inspected. The condition of the remaining 50% to 70% was unknown. While not a limitation of the test, it certainly leaves a vast unexplored area.
Test Variables:
Any O-ring artifact - scarf joint, patch, repair, surface irregularity, etc.
Results/Conclusions:
1. The dark space that thickens as noted on closeout photograph Figure 8 (Test Report) was a shadow of grease on the edge of the land above the secondary O-ring, not a defect or a damaged area of the secondary O-ring.
2. The small scale structures could be easily reproduced by a surgically gloved hand applying grease to the clevis. The presence of these structures does not reinforce the hypothesis of an O-ring defect or damage in that area.
3. The circular artifact as noted in the closeout photograph of Figure 5 (Test Report) is a grease structure and not a contaminant.
4. No defects, damaged O-rings, or contaminants, were apparent from the closeout photographs.
|
Test No. MTI 101 |
Test Report Date: 2/27/86 |
Objective:
Characterize potential Leak Check Port plug failure modes including: assess if assembly of Port Plug can damage the O-ring; determine if the torque on an assembled port plug relaxes when the fixture is cooled to a lower temperature; determine the effect of various torques on the ability of plug O-ring to seal; and determine the leakage rate of a port plug without an O-ring.
Test Description:
A series of 10 tests were conducted using the fixture shown Figure C.16. All but one of the tests were conducted at ambient conditions. The test activities included the following:
Plug with new O-ring torqued to 60 in-lbs. checked for leak at 200 psi and 1000 psi.
Plug without O-ring torqued to 60 in-lbs at ambient temperature then cooled and plug checked for rotation at retorque.
Five plugs without O-rings torqued to 60 in-lbs and checked for leaks at 200 psi and 1000 psi and the leak rate measured.
Plugs with used O-rings torqued to 5 in-lbs and checked for leaks at 200 psi and 1000 psi.
Test Limitation:
All tests were conducted with cold gas rather than hot particle laden, motor exhaust.
Test Variables:
[L209] Results/Conclusions:
No damage of port plug O-ring was detected due to assembly and limited use of plug. Cooling of the torqued port plug assembly without an O-ring did not relax the initial applied torque. Port plugs having an O-ring either new or used will not leak when pressurized to 1000 psi, if the O-ring is visibly seated. Successful seating of O-ring can be achieved by finger-tightening the port plug. Port plugs without an O-ring leaked at varying rates when fully torqued to 60 in-lbs. These leak rates were:
|
Plug No. |
|
|
|
|
. | |||
|
1 |
|
|
|
|
1 |
|
|
|
|
1 |
|
|
|
|
2 |
|
|
|
|
2 |
|
|
|
|
2 |
|
|
|
|
3 |
|
|
|
|
3 |
|
|
|
|
3 |
|
|
|
|
4 |
|
|
|
|
4 |
|
|
|
|
4 |
|
|
|
|
5 |
|
|
|
|
5 |
|
|
|
|
5 |
|
|
|
Comparison of protest prediction with these measured leak rates showed the following, which are within 26 percent of the pretest predictions.
|
. |
| ||
|
|
|
| |
|
Motor Conditions |
|
|
|
|
. | |||
|
900 psia; 6156 °R |
|
|
|
|
800 psia; 6139 °R |
|
|
|
|
700 psia; 6020 °R |
|
|
|
|
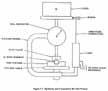
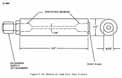
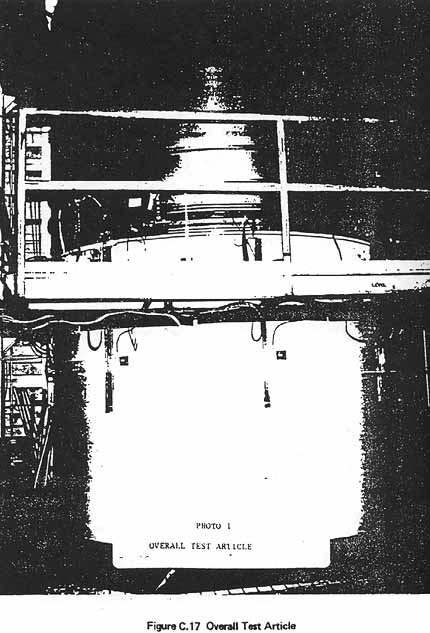
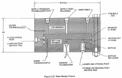
Test No. MTI 103 |
Test Report Date: 4/03/86 |
|
|
5/05/86 |
|
|
(ECD) |
Title: SRB Referee Test
Objectives:
To obtain structural data on the effects of pressurization upon the SRB motor case field joint including:
Test Description:
The test fixture (Figure C.17) is a stack of two full size SRB flight motor case segments (a lightweight attach segment and a lightweight cylinder segment) capped on each end by a proof test dome.
The tang, clevis, and membrane of the segments are instrumented with strain gages and deflection gages.
The stack is pressurized by hydropressure to approximately 1004 Psig.
Test Variable:
The tests are being performed in three sequences:
Sequence 1
The joint is instrumented to determine the following:
Each shim configuration was run twice-first taking deflection through the leak test port, then monitoring the pressure between the O-rings.
Sequence 2
The joint is instrumented the same as Sequence 1 except as follows:
Both O-rings installed
Both O-rings installed
Primary O-ring removed
Primary O-ring removed
Sequence 3
Joint is instrumented to determine the stresses and strains in the tang and clevis and the load path through the joint.
Results/Conclusion:
The key results from Sequence 1 are summarized below:
|
Test No. |
|
|
|
|
|
|
. | |||||
|
Shim Thickness (inch) |
|
|
|
|
|
|
Average Seal Gap Opening (inch) |
|
|
|
|
|
|
Range Max (inch) |
|
|
|
|
|
|
Min (inch) |
|
|
|
|
|
It can be observed that for the standard (flight) configuration, the seal gap was opened an average of 0.033 inch which is in the mid range of the previous measurements (i.e. 0.028 inch to 0.042 inch at 1004 psig). It can also be observed that the addition of thicker shims did in fact reduce the relative gap displacement; however, the reduction was only slight.
The key results from Sequence 2 are summarized below:
|
TEST NO. |
|
|
|
|
|
. | ||||
|
Shim Thickness (inch) |
|
|
|
|
|
Average Seal Gap Opening (inch) |
|
|
|
|
|
Range Max(inch) |
|
|
|
|
|
Min (inch) |
|
|
|
|
[L211] Other results from Sequence 2 are:
1. The seal gap opening at the tang locator slots is less than at any other location measured and is within analytical predicted values.
2. With the primary O-ring removed the seal gap opening increases. The increases were 0.011 for the 0.034 shims and 0.008 for the 0.050 shims. Although removing the primary O-ring increases the seal gap opening, the secondary, O-ring seal retains pressure.
3. During test article assembly there was an insignificant load measured in the joint. The girth gage deflections recorded were less than 0.00001 inch.
4. The testing for Sequence 3 has not been accomplished yet. Plans are being implemented to install an External Tank attach ring on this (or follow-on) test sequence. The objective is to quantify the reduction in gap opening of the aft joint due to the added stiffness afforded by the ring.
|
Test No. MTI 104 |
Test Report Date: 4/03/85 |
|
|
5/25/86 |
|
|
(ECD) |
Title: Full Scale joint Cross Section Test Firings
Objectives:
Test Description:
The 70-pound charge motor joint test section and nozzle configuration used is shown in Figure C.18. Not shown is the 70-pound motor pressure chamber which contains the end burning grain designs. Both the insulation and joint thicknesses are the same as the full scale design. The configuration was designed to have the same heat flow characteristics as the full scale design when subjected to a single point O-ring failure. The design incorporates all the full scale joint features except diameter. These features are full scale pins, leak check port, Viton O-rings, pin spacers and pin retention band. The insulation material is silicafilled NBR instead of asbestos-filled NBR to avoid the health hazards associated with asbestos. The insulation gap is designed to nominal, full scale dimensions. Randolph putty and Conoco calcium HD-2 grease is used in all tests.
Results/Conclusions:
The tests that have been accomplished to date are shown in the attached Table C.6. Also shown are the conditions for each test. The observations resulting from these tests are:
|
Test No. MTI 105 |
Test Report Date: 3/13/86 |
|
|
5/21/86 |
|
|
(ECD) |
Title: Five-inch Motor Tests
Objectives:
The objectives of this test activity were to:
Test Description:
The test motor used for these tests is shown in Figure C.19. It was tested in either a center perforated grain (CP) configuration which provided approximately 3 seconds of burn time or an end burner grain (EB) configuration which provided approximately 22 seconds of bum time.
Test Limitations:
The test configuration was subscale and did not represent the configuration of the SRM joint.
[L218] Test Variables:
Results/Conclusions:
The tests that have been accomplished to date are shown in the attached Table C.7. Also shown are the conditional for each test. The observations resulting from these tests are:
|
Test No. MTI 107 |
Test Report Date: 4/03/86 |
|
|
4/21/86 |
|
|
(ECD) |
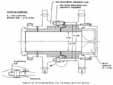
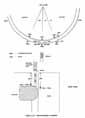
Title: Dynamic Vacuum Putty Extrusion Tests
Objective:
Determine putty response to SRM start pressures at conditions representative of STS 51-L launch and assess O-ring pressurization during the motor ignition transient.
Test Description:
The dynamic vacuum putty extrusion test fixture consists of a full scale cross section representation of the SRM clevis inner leg and tang. A 10-inch-diameter model (Figure C.20) is used to complete the tests. Pressures and temperatures were recorded during assembly of the tang-to-clevis and during the simulated SRM chamber pressurization. Photos were made of all disassemblies to assess the putty condition and location. The test matrix is shown in Figure C.21.
Test Limitations:
The tests were representative of a full scale SRM joint except for three features: (1) O-ring inside diameter (9.33 inches), (2) volume between primary and secondary O-rings, and (3) volume between primary O-ring and vacuum putty.
Test Variables:
- 1) Tang-to-clevis end gap
- 2) Putty exposure to humidity
- 3) Simulated launch temperature
- 4) Putty back-blowhole condition
Results/Conclusions:
The pressures recorded between the putty and primary O-ring during normal stacking produced pressures consistently up to 46 psig. These assembly pressures created back-blowholes in the putty which resulted in O-ring pressurization times to 20 psig ranging from 0.159 to 0.572 second, with the earlier pressurization occurring at the lower temperatures. After a back-blowhole was formed during the fixture assembly, the putty did tend to reseal he damaged area. This was verified by the pressure between the putty and primary O-ring reestablishing subsequent to a blowhole during the 200 psig O-ring leak check prior to simulated SRM start. Also, some disassembly photos showed back-blowholes with no red chalk which was introduced in the inlet pressurization line during SRM simulated start.
Some test fixture assemblies were done with the volume between the putty and primary O-ring vented to prevent back blowholes. The ties required to pressurize the primary O-ring to 20 psig was highly influenced by temperatures, putty gap width, and putty humidity (water content.) Pressurization times to 20 psig ranged from 0.20 second to 20.72 seconds with the higher duration occurring with as packaged putty at 20°F in a minimum gap. Disassembly of the tang and clevis fixture showed some putty to the primary O-ring on approximately 80 percent of tests.
These tests imply that the putty may provide seal of the SRM joint during SRM start transient, which causes delayed O-ring pressurization.
|
Test No. MTI 108 |
Test Report Date: TBD |
Title: O-Ring Viscoelastic Properties Tests
Objective:
To characterize the viscoelastic response of the SRM case joint fluorocarbon O-ring material.
Approach:
Results:
The fluorocarbon O-ring material behaves as a typical amorphous, viscoelastic material.
The glass transition temperature Tg of the O-ring material is in the range from -10°F to +5°F, which is high compared to the values for general purpose elastomers.
Below Tg the O-ring material is "glassy." Well above Tg it is "rubbery." The region between the glassy and rubbery states is called the "transition" region.
The transition region extends from Tg to approximately 50°F. In the transition region, the mechanical properties change dramatically with temperature because of the change in mobility of the fluorocarbon polymer chains.
The failure properties of the O-ring material are typical of a viscoelastic material.
The relaxation modulus data exhibit strong temperature and time dependence.

|
[L226] Test No. MTI 109 |
Test Report Date: 4/03/86 |
Title: O-Ring Static Blowby Test
Objective:
Determine primary O-ring seating characteristics in a constant depth gland as a function of temperature and squeeze. Specifically, determine the blow-by past the primary O-ring and the primary O-ring seating pressure.
Test Description:
Test Limitations:
Test article is limited to one fixed gap position. The O-ring squeeze was varied by using O-rings of different cross-sectional diameter (0. 247 inch to 0. 292 inch). This condition produces difference O-ring/groove geometry for each test condition.
Test Variables:
Results/Conclusions:
The 14.5% (0. 292 inch) O-ring failure point is at -20°F or lower as shown in the attached Table C.8. The 5% (0. 261 inch) and 12% (0.282 inch) O-rings failed at -20°F. At -10°F these two O-rings showed discernible blow-by (0.01%) The "zerosqueeze" O-ring (0.247 inch) failure point was near 35°F with the 1000 psi pressurization curve and near 15°F with the STS 51-L pressurization curve.
In a stationary gap, gas will blow by an O-ring as the temperature approaches the static seal failure temperature (35°F .for the 0.247 inch O-ring, -20°F for the 0.261 inch and 0.282 ;inch O-rings, -20°F or lower for the 0.292 inch O-ring).
Available data for the primary O-ring seatings pressure were insufficient to draw any conclusions.
|
Test No. MTI 110 |
Test Report Date: 4/02/86 |
Title: O-Ring Dynamic Blowby Test
Objective:
Determine primary and secondary O-ring sealing characteristics in a cold gas test article that simulates joint rotation.
Test Description:
Test Limitations:
Gap opening is a function of chamber pressure only. Rounding effects cannot be simulated. Cold pressurization gas provides no information on O-ring erosion. Fixed volume of supply gas causes a deviation in the pressurization curve if significant blow-by occurs.
Test Variables:
Gap dimensions:
- 0.004-inch initial gap/0.027-inch gap growth
- 0.020-inch initial gap/0.020-inch gap growth
Temperature:
-10°F through 70°F
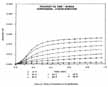
Results/Conclusions:
The results of the test activity are shown in Figure C.24 and summarized below:
0.020-Inch Initial Gap/0.020-Inch Growth Gap
0.004-Inch Initial Gap/0.027-Inch Growth Gap
Within the limits of this test, a small initial gap reduces the ability of the primary O-ring to seal at temperatures of 50°F and below. One possibility is that the exposed O-ring surface area, which is necessary for pressure actuation of the O-ring, is reduced by the tight initial gap and contact with the endwalls reducing the force necessary to deform the O-ring and track the sealing surfaces.
|
Test No. MTI 111 |
Test Report Date: 4/01/86 |
Title: O-Ring Resiliency Test
Objective:
Determine the ability of an O-ring to remain in contact with a moving sealing surface without the aid of pressure actuation.
Test Description:
Test Limitation:
Only a 3 inch section of an unstretched O-ring is tested. The O-ring is held in compression for 30 minutes, which does not produce the compression set expected for a 52-day compression.

[L232] Test Variables:
51-L Conditions (First Matrix, Completed)
51-L Condition (Second Matrix, Scheduled)
3 tests at each condition (36 total tests)
Results/Conclusions:
The most representative parameter for judging O-ring separation in the first indication of backlight on the high-speed film.
Very little difference is seen between the results for primary and the secondary displacement curves at temperatures at 40°F and below.
Data at 75°F for the secondary O-ring is based on the assumption that the O-ring will follow the gap through the entire initial compression distance (0.0375-inch). Actual gap growth ends at 0.0245-inch with the O-ring still in contact. Thus the difference in the results for primary and secondary displacement curves at 75°F is not distinct. The primary O-ring separates at about 0.022-inch. Even though the secondary O-ring does not separate, secondary zap growth ends a 0.0245-inch.
The ability of a nonactuated O-ring to follow a growing seal gap without pressure actuation is significantly diminished at temperatures of 40° and below.
|
Test No. MTI 112 |
Test Report Date: 2/14/86 |
Title: SRM Frozen Field joint Test
Objective:
The purpose of the frozen field joint test was to evaluate the effects of temperature and moisture (water) within an SRM case field joint: specifically, deflections where the joint is full of water and frozen.
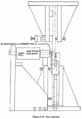
Test Description:
Fill an assembled clevis joint (short stack fixture.) with water (Figure C.26) and freeze in increments down to -20°F and measure:
1. Clevis spreadings
2. Seal gap changes
Test Limitations:
None - full scale joint hardware was used
Test Variables:
Temperature
Results/Conclusions:
The data obtained during this test are:
|
|
|
|
|
|
|
. | ||||
|
|
|
|
|
|
|
|
|
|
|
|
|
|
|
|
|
|
|
|
|
|
|
|
|
|
|
|
|
|
|
|
|
|
|
|
|
|
|
|
|
|
|
|
|
|
|
|
|
|
|
|
|
|
|
|
|
|
|
|
These data indicate the amount of movement was within the measurement error. It is therefore concluded that the small amount of moisture frozen in a field joint would cause insignificant spreading of the clevis.
|
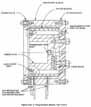
Test No. MTI 113A |
Test Report Date: 4/2/86 |
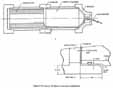
Title: Hot O-Ring Extrusion Test
Objective:
Determine when and how an O-ring fails due to heating of the adjacent metal.
Test Description:
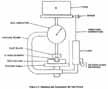
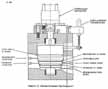
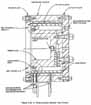
A piston/ring fixture made of mild steel has been designed to replicate the HPM-SRM field joint configuration about the primary O-ring. Top and side views of the fixture are shown in Figure C.27. The upper O-ring gland simulates the primary 0-ring gland. The lower O-ring gland is used to contain pressure within the fixture-it does not simulate the secondary O-ring gland. The O-rings used in this test are the same fluorocarbon O-rings used in flight. Their cross sections range from 0.280 to 0.284 inches, which is within flight hardware tolerance. An oxygen/aectylene torch was used to provide the external heating of the metal parts. The heating rate was controlled by distance of the flame to the ring and by the oxygen/acetylene mixture.
Test Limitations:
Test Variables:
Results/Conclusions:
The results from the test are summarized in the following table:
|
. |
|
|
| |
|
|
| |||
|
. | ||||
|
20 |
|
|
|
|
|
21 |
|
|
|
|
|
3 |
|
|
|
|
|
5 |
|
|
|
|
|
16 |
|
|
|
|
|
17 |
|
|
|
|
|
9 |
|
|
|
|
|
12 |
|
|
|
|
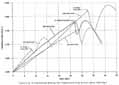
The principal factors affecting failure proved to be temperature and heating rate. Temperature is important in that the joint surface must become hot enough to physically melt the O-ring. The....
[L235] ....heating rate controls the time it takes for the joint to reach this temperature. When the heated surface temperature reaches 1000°F, the O-ring begins extruding beyond the normal amount due to pressure. As the hot O-ring material extrudes, cold material is forced into the gap by the pressure, thus maintaining the integrity of the seal. When the amount of nonmelted O-ring cross section becomes too small to withstand the stresses induced by the pressure, the O-ring is completely severed causing failure.
Four tests cases, plotted from the point at which the joint wall reaches 1000°F are shown in Figure C.28. From this figure it can be seen that the O-ring extrusion gap size is a contributing factor (the smaller the gap the longer time to failure), but it represents only a secondary effect because of the relatively long time to reach the critical 1000°F temperature.
|
Test No. MTI 113B |
Test Report Date: 4/2/86 |
Title: Cold O-Ring Extrusion Test
Objective:
To determine if an O-ring under pressure can be cut by a sharp groove edge.
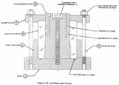
Test Description:
A piston/ring fixture made of mild steel has been designed to replicate the HPM-SRM field joint configuration about the primary O-ring. Top and side views of this fixture are shown in Figure C.29. The upper O-ring gland simulates the primary 0-ring gland. The upper edge of the groove has been held very sharp (the burr left from machining was not removed), unlike the normal flight configuration which is rounded. The lower O-ring gland is used to contain pressure within the fixture it does not simulate the secondary O-ring gland. The O-rings used in this test are the same fluorocarbon O-rings used in flight. Their cross-sections range from 0.284 to 2.084 inch, which is with flight hardware tolerance.
Test Limitations:
Test Variables:
Results/Conclusions:
In this test no significant damage was caused to the O-rings due to a sharp piston edge, even with pressure of 1000 psi applied. At most, a small indentation was left around the O-ring inner circumference where contact was made with the sharp edge. This indentation would disappear in a short time (less than 5 minutes) leaving a barely visible scratch. No leakage past the O-ring occurred during any of the tests.
|
Test No. MTI 114 |
Test Report Date: TBD |
Title: Ice in joint Tests
Objective:
Determine ability of the secondary O-ring to seal with ice in joints under dynamic conditions.
Test Description:
The test fixture is shown in Figure C.30. Following assembly and successful leak testing, a pressurization fixture is used to apply pressure to the downstream side of the secondary O-ring. This operation is to reposition the O-ring to the upstream side of the groove, as indicated by tests at MSFC.
Distilled water is introduced into the gap using a hypodermic syringe and needle. The fixture is then conditioned to 25°F and tested.
Test Limitations:
Test Variables:
Results/Conclusions:
Six tests were conducted in this series. The tests were based on the results of the 0-ring Dynamic Blowby Test series. That series of tests showed the following important results:
1. At 25°F with an initial gap of 0.004 inch, the primary 0-ring consistently leaks at a chamber pressure between 200 and 400 psig. There is a significant amount of blow-by past both seals generally followed (4 out of 5 times) by seating of the secondary O-ring with no further indication of leakage.
2. At 25°F with an initial gap of 0.020 inch, the primary O-ring seals with little or no leakage or blow-by. The secondary O-ring in this case is not forced to seat.
Because of the pronounced difference in behavior at these two sets of conditions and in order to assess the effect of ice on the secondary O-ring sealing capability, different approaches had to be taken for the two sets of test conditions.
With an initial gap of 0.004 inch, it was simply a matter of repeating the earlier tests but with ice introduced into the secondary O-ring groove. The results of these tests were then compared to the earlier tests to assess the effect of ice. The comparison shows that ice does seriously impair the sealing capability of the secondary O-ring with this set of test conditions.
For an initial gap of 0.020 inch, it was necessary to create a situation in which the secondary O-ring was forced to function. Therefore, these tests were run with the primary O-ring removed. In order to provide a basis for evaluation, the first two tests were run without ice. When the comparison was made of the tests with and without ice, it was again obvious that ice had a serious detrimental effect on the capability of the secondary O-ring to seal.
The results to these tests indicate that ice in the secondary O-ring groove will impair the sealing characteristics of the secondary O-ring.
|
Test No. MTI 115 |
Test Report Date: 2/13/86 |
Title: O-Ring Twist Test/Demonstration
Objective:
To reproduce the apparent anomaly seen in the 51-L closeout photo of the right SRB aft/center aft joint secondary O-ring (photograph 108-KSC-860-13).
Test Description:
Test Limitations:
Camera, film, lighting, angles, and distance details for 51-L close out photo were unknown.
Test Variables:
Results/Conclusion
|
Test No. MTI 117 |
Test Report Date: 4/23/86 |
|
|
(ECD) |
Title: Seal Contamination Test
Objective:
The objectives of these test are to:
Test Description:
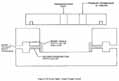
The testing is being accomplished on three test fixtures: the static blow-by test fixture, the short stack test fixture, and the dynamic blow-by test fixture.
Testing was accomplished in the static blow-by test fixture to find the contamination configurations and sizes that could escape destruction by the 50 psig leak check. Configurations tested were round wire at diameters of 0.001, 0.003, and 0.006 inches, oval wire at 0.002 x 0.04 inches, and rectangular shim shock 0.002 x 0.020 inches. The initial test were accomplished with a volume between the O-rings of 0.46 cubic inches, while the remaining tests were accomplished with a volume of between the O-rings of 14.3 cubic inches (same as full size joint). All test were accomplished with the same nominal O-ring squeeze (14.5%) at room temperature (70°F).
Testing was accomplished in the short stack to compare the results of the subscale static blow-by tests with results from a full scale joint leak test. Configurations tested were round wire with a diameter of 0.003 inch, oval wire 0.003 - 0.024 inch, and rectangular shim stock 0.008 or 0.023 inch. The tests were accomplished with a volume between the O-rings of 5.27 cubic inches, an O-ring squeeze of 21%, and at room temperature (70°F).
Testing with the dynamic blow-by fixture will be conducted to determine the impact of contamination on O-ring seal ability. The contamination will be glued to the nylon sleeve of the fixture transverse to the primary O-ring foot print. A 50 psig, leak check will be conducted at ambient temperature, and then the fixture temperature will be adjusted for the dynamic test.
Test Limitations:
Results/Conclusions
The data from the static Blowby test fixture and the Short Stack test fixture are summarized Figure C.31. The data show that all three configuration shapes produce essentially the same results within the variability of the data, and size which will just pass the 50 psig leak check is in the 0.001 to 0.003 inch range. The efforts of this type contamination of the seal performance is (TBD).
|
Test No. MTI 119 |
Test Report Date: 4/2/86 |
Title: O-Ring Assembly Damage Test
Objectives:
To access whether assembly conditions could cause the O-ring to "pooch out" of the O-ring groove in a local area, and if that would cause O-ring damage. A leak test was also run to determine if the damage would pass leak test or not.
Test Description:
The Short Stack tang clevis, which are full scale hardware per Drawing 7U52773, were used as the test hardware.
Test Limitations:
Test Variables:
Two primary variables were involved in the tests: (1) O-ring major diameter, and (2) tipping one segment so that a misalignment of 1.0 ± 0.20 inches exists from one side to the other. During assembly, metal contact was forced between the tang and clevis on the initial lead-in side.
(1) Three mating operations using O-rings with major diameters near the minimum drawing requirements.
(2) Three mating operations using O-rings near the maximum diameter allowed by drawings.
(3) Tree test with these large diameter O-rings being stretched approximately 3 inches and allowed 30 minutes to recover.
Results/Conclusions:
Adverse assembly conditions including forced metal-to-metal contact between the part at the tang lead-in location, sequential O-ring contact caused by assembly with the tang tipped relative to the clevis, and even using overstretched O-rings did not result in damage to the O-rings in this test. This test, however, is not considered conclusive since the short stack test fixture does not approach the conditions for full scale motor with propellant. (There were some O-ring damage caused by instrumentation ports in the hardware, which was peculiar to the test hardware, and would not occur on flight hardware.)